Prop Firm Simulator: Find the Strategies
That Actually Get Paid
Replay any portfolio through a prop firm's challenge and funded-account rules, bar by bar, from every start date. See the probability of a payout and the expected cash per attempt after all fees, not just the pass rate.
- What Is a Prop Firm Simulator?
- Why I Built It
- Prop Firm Math: Cash Flow vs. P&L
- Worked Example: The $100 Challenge
- Passing Is Not Getting Paid
- The Expected Value Formula
- Real Payout Rules Change the Answer
- Which Strategies Fit a Prop Account?
- The Prop Firm Workflow
- Setting Up the Simulator
- New Prop Firm Fitness Functions
- Reading the Results
- Account Paths
- Challenge Finder
- Why Start Dates, Not Monte Carlo
- Prop Rules in Your Live Code
- What It Cannot Tell You
- FAQ
What Is a Prop Firm Simulator?
A prop firm simulator replays a trading strategy or portfolio through a proprietary trading firm's evaluation and funded-account rules, bar by bar, from many historical start dates. Instead of asking whether the backtest made money, it asks what a prop trader is actually paid on: how often does this portfolio pass, how often does it reach a payout, and what is one challenge purchase worth after all fees?
Build Alpha's Prop Firm Simulator models the challenge, the funded account and the payout gates together: profit targets, trailing and end-of-day drawdowns, daily loss limits, contract limits, minimum trading days, consistency rules, monthly fees, resets, payout floors and caps. It can then search your saved strategies for the portfolios with the most expected cash per attempt.
The Short Answer
Pass rate is the wrong target. The portfolio that passes most often is often not the one that pays the most. Build Alpha ranks portfolios by Expected Net / Attempt: the probability of passing, times the expected net profit of the funded account, minus the average evaluation fees.
Why I Built a Prop Firm Simulator
Over the past year, the requests for prop firm features from existing Build Alpha users became overwhelming. Many are already running Build Alpha strategies in evaluation and funded accounts. The requests became too overwhelming to ignore. And there's good reason: a prop firm account changes the economics of a strategy, sometimes completely.
Most traders still judge a prop strategy the way they judge any strategy: net profit, max drawdown, maybe a Monte Carlo simulation. Then they buy the challenge and learn that trading your own capital is drastically different than trading prop capital. I wanted a tool that measures what a prop trader is actually paid on.
Prop Firm Math
A strategy can have poor economics when trading your own capital, yet attractive economics when you pay a fixed fee for a share of the upside. In a prop account, your cash flow is not the strategy's P&L. Your loss on an attempt is capped at the fees you pay, and the firm absorbs the rest of the left tail.
That matters most for negatively skewed strategies: many small wins and the occasional large loss.
No one should trade that with personal capital. But watch the same strategy through a prop firm.
Worked Example: The Same Strategy Inside a $100 Challenge
Consider a fictional prop firm with simple rules:
- A $100 total fee per attempt.
- The evaluation requires $1,000 of profit, which takes five winning days.
- The funded account requires another $1,000, five more winning days, before you can withdraw.
- You receive 80% of the funded profit: $800.
- A $2,000 loss at either stage breaches the trailing loss limit and ends the attempt.
- Your cash loss is limited to the $100 fee.
- To keep it simple, you stop after the first payout.
To get paid, the strategy needs ten normal days before its first bad day. The probability is 0.9 multiplied by itself ten times:
Nothing about the trades changed. With your own capital, the $2,000 day loss is yours. Inside the prop account, the worst case is the $100 fee, and the expected value flips from a steady loss to about +$179 per attempt. On average it takes 1 ÷ 0.349, or about 2.9 attempts, to collect a payout: roughly $287 in fees against $800 received.
| Same strategy | Own capital | Prop account |
|---|---|---|
| Worst outcome | −$2,000 per bad day, with no cap over time | −$100 per attempt |
| Best outcome | +$200 per day | +$700 per attempt, after the fee |
| Expected value | −$20 per day | ≈ +$179 per attempt |
| Who absorbs the tail | You | The firm |
This Is Not a License to Trade Losing Strategies
The example is deliberately extreme to make the math obvious. Real firms price their fees and write their payout rules with this in mind, and real payout gates erase much of the edge in a toy example. The practical use is covered below: positive-expectancy strategies whose tail risk makes them unattractive for personal capital.
Passing the Evaluation Is Not Getting Paid
The above example strategy passes the evaluation 59% of the time. It collects a payout only 35% of the time.
Pass rate is the number everyone quotes, but it stops at the halfway point. A pass only buys you the right to face a second set of rules: the funded drawdown, qualifying days, payout windows, caps and consistency conditions. A portfolio can pass easily and then struggle to ever clear a payout gate. Which is actually what traders want.
So the research question is not "which strategy passes most often?" and it is not "which strategy has the best backtest?" It is:
The Expected Value of a Prop Firm Challenge
That question has a formula. For a single attempt:
The example stops at the first payout. Real accounts do not, so the formula has to extend to everything that moves cash:
- Repeated payouts. A funded account can pay several times before it breaches or the test ends. Count all of them, not just the first.
- Failed attempts and resets. Every failure costs a fee, and resets add cost without adding a fresh start date.
- Elapsed time. Monthly evaluation fees mean a slow pass costs more than a fast one, and payout windows mean cash arrives on a calendar, not instantly.
- Money actually withdrawn. Payout caps, splits, minimums and floors decide what leaves the account. An account balance is not cash.
Build Alpha's headline metric, Expected Net / Attempt, is that formula run on your actual portfolio: Pass Prob multiplied by the Expected Net Profit of a funded account (payouts minus funded fees), minus the average evaluation fees. It answers: what is one challenge purchase worth?
Real Payout Rules Change the Answer
Real firms put gates between a profitable funded account and a payout. Those gates have to be modeled together with the drawdown rules, because the same equity path can clear one gate and fail another.
Topstep is a good example. As of October 2026, its payout policy includes:
- Qualifying days. The Express Funded Account Standard path requires five winning days of $150 or more in net P&L before a payout request.
- Consistency. The Consistency path requires three trading days, and no single day may exceed 40% of total net profit.
- Payout caps. Each request is limited to 50% of the balance up to a cap that depends on the path and account size, for example $2,000 (Standard) or $3,000 (Consistency) on a $50K account.
- Profit split. 90/10 in the trader's favor.
These rules interact with the drawdown in ways a backtest cannot see. A strategy that makes its money in two big days fails a 40% consistency test. A strategy that needs eight weeks to log five qualifying days pays monthly fees the whole time. A 50% cap means a fast winner leaves money in the account, exposed to the drawdown, until the next request.
Rules Change Often
Topstep changed its rules several times in 2026, and other firms are no different. Check the firm's current terms before you trust a simulation, and update your saved rule set when they change. I am working on an AI agent that can do this automatically.
Which Strategies Fit a Prop Account?
The example above used a losing strategy to make the math obvious. In practice, focus on strategies with positive expectancy whose tail risk makes them unattractive for personal capital.
You know the type. The strategy makes money over time, but every so often it gives back a large chunk. Trading it with your own money means funding the account for the worst drawdown, which can make the return on capital unattractive. Inside a prop account, your downside per attempt is the fee. The firm carries the tail, and you keep a share of the upside.
The return stream does not need to be concave. You do not need a short-volatility profile of many small wins and rare large losses. Trend, mean reversion, breakout and multi-market portfolios all qualify. What matters is how the path interacts with the rules:
- Speed to target. Reaching the profit target before the drawdown catches you. Monthly fees make slow passing expensive.
- Loss clustering. Losses that arrive together, often in the same market regime, breach trailing drawdowns that a scattered sequence of the same losses would survive.
- Daily P&L shape. Qualifying-day minimums and consistency caps are judged by trading day, so the shape of your daily P&L matters as much as the total.
- Size. The contract limit and multiplier decide whether a good strategy is too slow, about right, or too fast to survive.
Those are exactly the things the simulator measures.
The Prop Firm Workflow in Build Alpha
The workflow is simple: build a large pool of candidate strategies, then let the simulator find the combinations the rules actually pay.
Breadth is the point of step two. The simulator assembles portfolios from whatever you give it, so a pool that spans different timeframes, strategy types and symbols gives it uncorrelated pieces to combine. A pool of 30 near-identical strategies gives it one strategy 30 times. Automatic strategy generation is the fastest way to build that pool.
Run your usual robustness tests on the strategies before they go into the pool. The simulator tells you how the rules treat a return stream. It cannot tell you whether that return stream is real.
Setting Up the Prop Firm Simulator

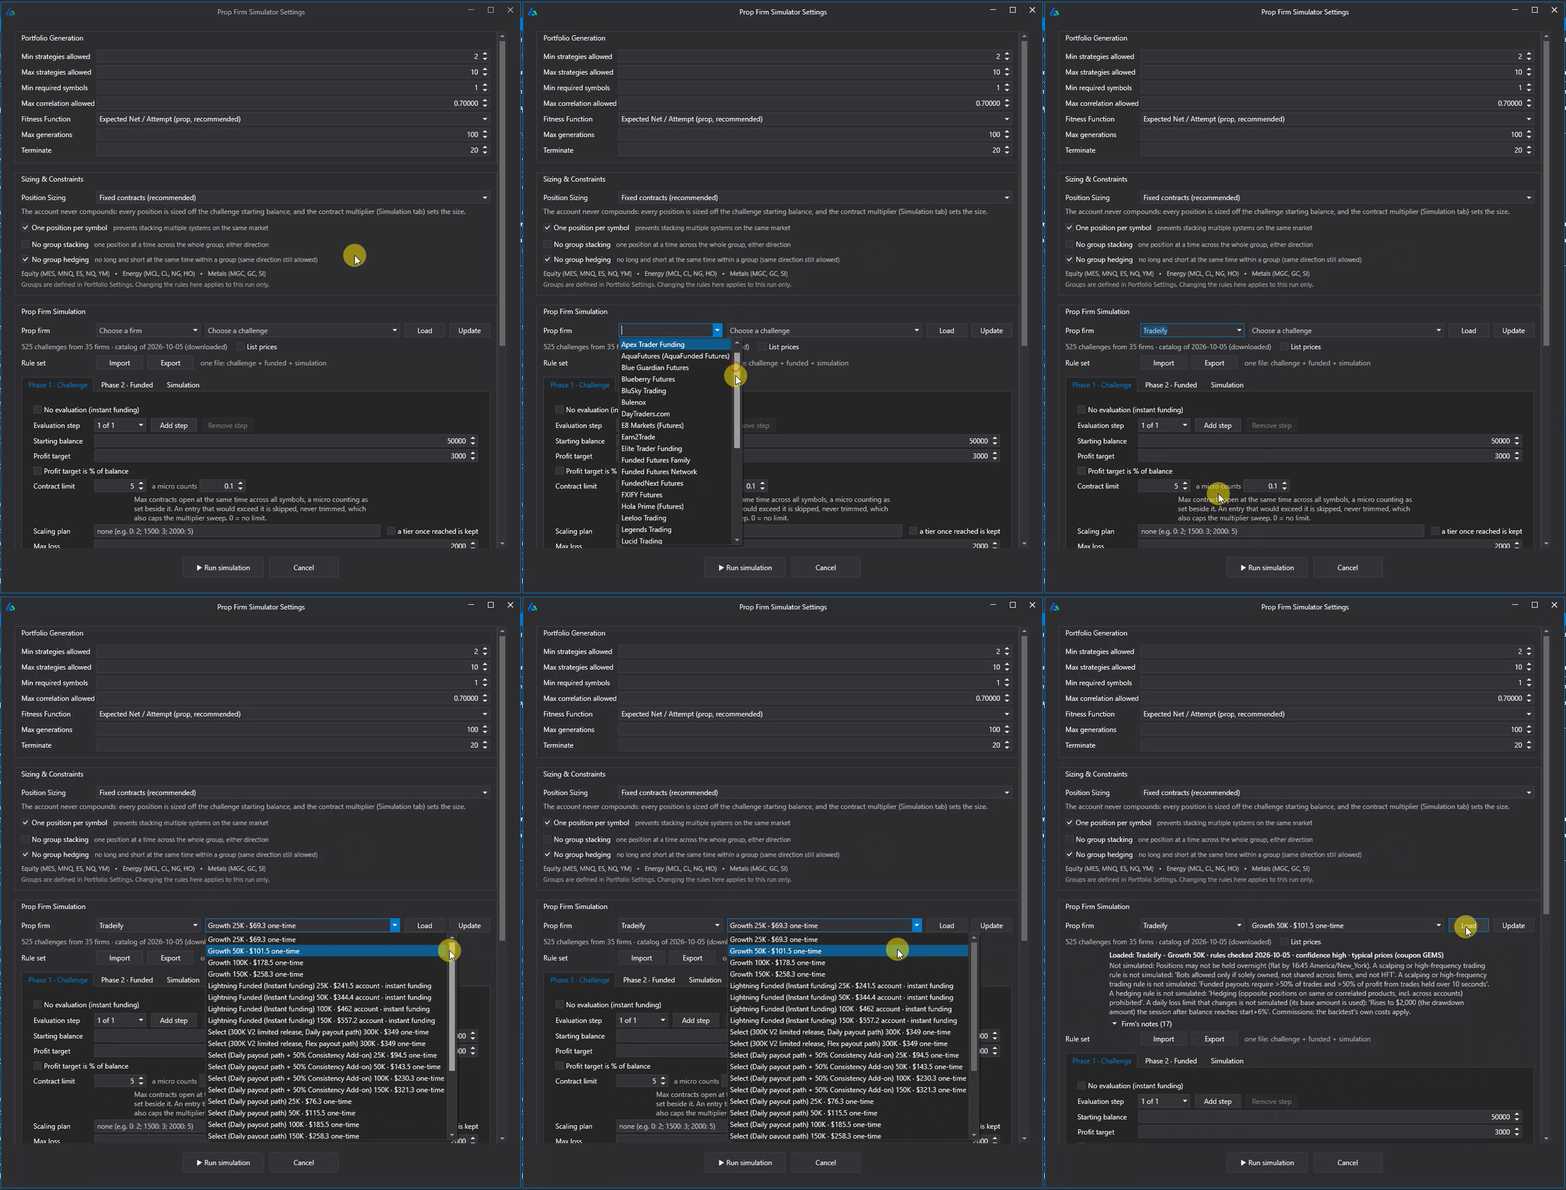
The settings window has three parts.
Portfolio Generation
The simulator does not just score one portfolio. It searches combinations of the strategies you added: between a minimum and maximum number of strategies, across a minimum number of symbols, and under a maximum correlation cap (0.70 in the screenshot). It evolves those portfolios toward the fitness function you choose. Max generations caps the search, and Terminate ends it early once it stops improving.
Sizing & Constraints
Position sizing defaults to Fixed contracts, the recommended setting. The account never compounds: every position is sized off the challenge starting balance, and a whole-number contract multiplier on the Simulation tab scales every strategy in the portfolio by the same amount.
Prop Firm Simulation: Challenge, Funded and Simulation
The evaluation: starting balance, profit target in dollars or % of balance, contract limit, max loss and its type (such as EOD trailing) with an optional lock level, daily loss limit and its action, minimum trading days and what counts as a day, an optional time limit, the monthly evaluation fee, reset rules and an optional consistency cap.
The funded account's own rules: its drawdown and loss limits, plus the payout gates that decide when cash actually leaves the account, such as qualifying days, the payout floor, caps, the profit split and funded fees.
How the test runs: the contract multiplier that sets size and the horizon each start date is followed for, so time-based rules and payout windows play out on real trading days.
Two details matter more than they look. First, the contract limit counts every contract open at the same time across all symbols, and micro contracts count as 0.1 (a Micro E-mini is one-tenth the size of the E-mini). When an entry would push the portfolio over the limit, the whole order is skipped, never trimmed. Second, the strategies are simulated together bar by bar, not by merging separate trade lists, so the drawdown, the daily loss limit and the contract limit see the portfolio exactly as the account would.
Rule sets save to a single file that holds the challenge, funded and simulation settings together. Import and Export let you keep one file per firm and account size, reuse it across portfolios and share it.
Choose Your Prop Firm and Challenge
You don't have to type the rules in. Build Alpha includes a database of futures prop firm challenges, and an AI agent scans the web to keep it current with the latest challenges, rules and pricing. Pick the firm, pick the challenge and click Load to fill the tabs with that challenge's rules.
As of this writing, the catalog holds 800+ active challenges from 42 futures prop firms. When a challenge loads, Build Alpha shows the date its rules were last checked, a confidence level, and any firm rules it cannot simulate, such as a ban on holding overnight, so you know exactly what the simulation covers.
New Prop Firm Fitness Functions
The fitness function decides what the portfolio search optimizes. Four new prop-specific options join the classics:
What one challenge purchase is worth after every fee. This is the expected value formula above run on your portfolio, and the only option that answers the research question directly.
Trader payouts per attempt divided by the cost per attempt. Useful for comparing portfolios when fee structures differ.
Share of start dates that hit the profit target before breaching. Useful as a check, risky as a goal: passing is not getting paid.
Favors portfolios whose funded accounts are still open at the end of the horizon. Useful when you plan to keep one account and draw repeated payouts.
Total backtest profit. Ignores every prop rule.
Profit relative to drawdown. Closer, but blind to timing, payout gates and fees.
Risk-adjusted return. A smooth curve can still fail a consistency rule or wait too long for a payout.
Reading the Prop Firm Simulator Results

Each row is a candidate portfolio. The columns are grouped by phase: Challenge metrics in green, Funded metrics in amber and Fitness metrics in blue. Every number comes from replaying that portfolio from each historical start date.
The Highest Pass Rate Is Not the Best Portfolio
The screenshot is sorted by Pass Prob. The top portfolio passes 90.7% of the time and is worth +$1,785 per attempt. Fourteen rows down, a portfolio that passes only 73.2% of the time is worth +$2,659 per attempt, with a 7.53x Prop ROI.
| Metric | Pass-rate leader | Row 15 |
|---|---|---|
| Pass Prob | 90.7% | 73.2% |
| 1st Payout Prob | 100.0% | 88.6% |
| Total Payout | $2,769 | $4,654 |
| Payouts / Year | 1.8 | 2.8 |
| Survival | 92.2% | 41.4% |
| Expected Net / Attempt | +$1,785 | +$2,659 |
| Prop ROI | 4.76x | 7.53x |
Notice the trade-off. The second portfolio's funded accounts survive less often, 41.4% versus 92.2%, yet they pay more because they reach payouts sooner and more often before the end. Survival, like pass rate, is a means to an end. The end is cash.
Fees show up too. For the top row, Pass Prob × Expected Net Profit is about $2,125 (0.907 × $2,343), yet Expected Net / Attempt is $1,785. The difference, roughly $340, is evaluation fees: about seven months at $49 a month, because this portfolio averages 124 trading days to pass. Slow passing has a price.
Every Metric, Defined
| Metric | What it measures |
|---|---|
| Expected Net / Attempt | Pass Prob × Expected Net Profit − average evaluation fees. What one challenge purchase is worth. |
| Prop ROI | Trader payouts per attempt ÷ cost per attempt. Cost is evaluation fees, including resets, plus Pass Prob × funded fees, floored at $1. |
| Metric | What it measures |
|---|---|
| Expected Net Profit | The trader's share of payouts minus fees, per funded account. |
| Survival | Share of funded accounts still open, not breached, at the end of the horizon. |
| Avg # Payouts before Fail | Average payouts collected by accounts that eventually breached. Blank when none breached. |
| Payouts / Year | Mean payouts per funded account × 252 ÷ the funded horizon in trading days. |
| Total Payout | Mean gross payouts per funded account over the horizon. |
| Avg Payout | Mean gross payout per payout event. |
| Median / Average Days to 1st Payout | Trading days from funding to the first payout, paid accounts only. |
| 1st Payout Prob | Share of funded accounts with at least one payout within the horizon. |
| Metric | What it measures |
|---|---|
| Pass Prob | Share of start dates that hit the profit target before breaching, within the horizon. |
| P90 / Median / Average Days to Pass | Trading days to pass, passing runs only. P90 shows the slow tail. |
| Unresolved | Share of start dates that neither passed nor failed within the horizon. Counted as not passed. |
| Independent Episodes | How many independent episodes the start dates hold. Adjacent start dates share most of their path. |
Account Paths: See Every Funded Start Date
Averages hide paths. Two portfolios with the same Expected Net / Attempt can get there very differently: one with steady payouts across most start dates, the other with a few lucky runs carrying everything. The Account Paths test shows you which.
Click any portfolio in the results window, then open Account Paths from the right-hand panel (the AP button). You get one line per funded start date, with the same portfolio and the same rules:
- Green: the run was still open at the horizon.
- Red: the run breached, with an ✕ at the breach.
- Amber: a payout taken.
- Reference lines for the payout floor and the drawdown lock, so you can see how much room each run had.

Hover any line to inspect that run. The other paths dim, each payout is labeled on the path, and the footer reports the funded date, how many start dates share that path, the number of payouts, gross payouts, net to the trader and the outcome.

In that example, the run took an $802 payout, then five payouts of $2,500, and was still open at day 250. Each payout drops the balance straight down, back toward the payout floor and the drawdown lock. That is the point of seeing paths: every withdrawal costs you cushion, and you can see whether the portfolio rebuilds it.
What to look for: payouts spread across many start dates rather than a handful, breaches that cluster in one period (a regime problem, not a sizing problem), and runs that hover just above the drawdown line for months.
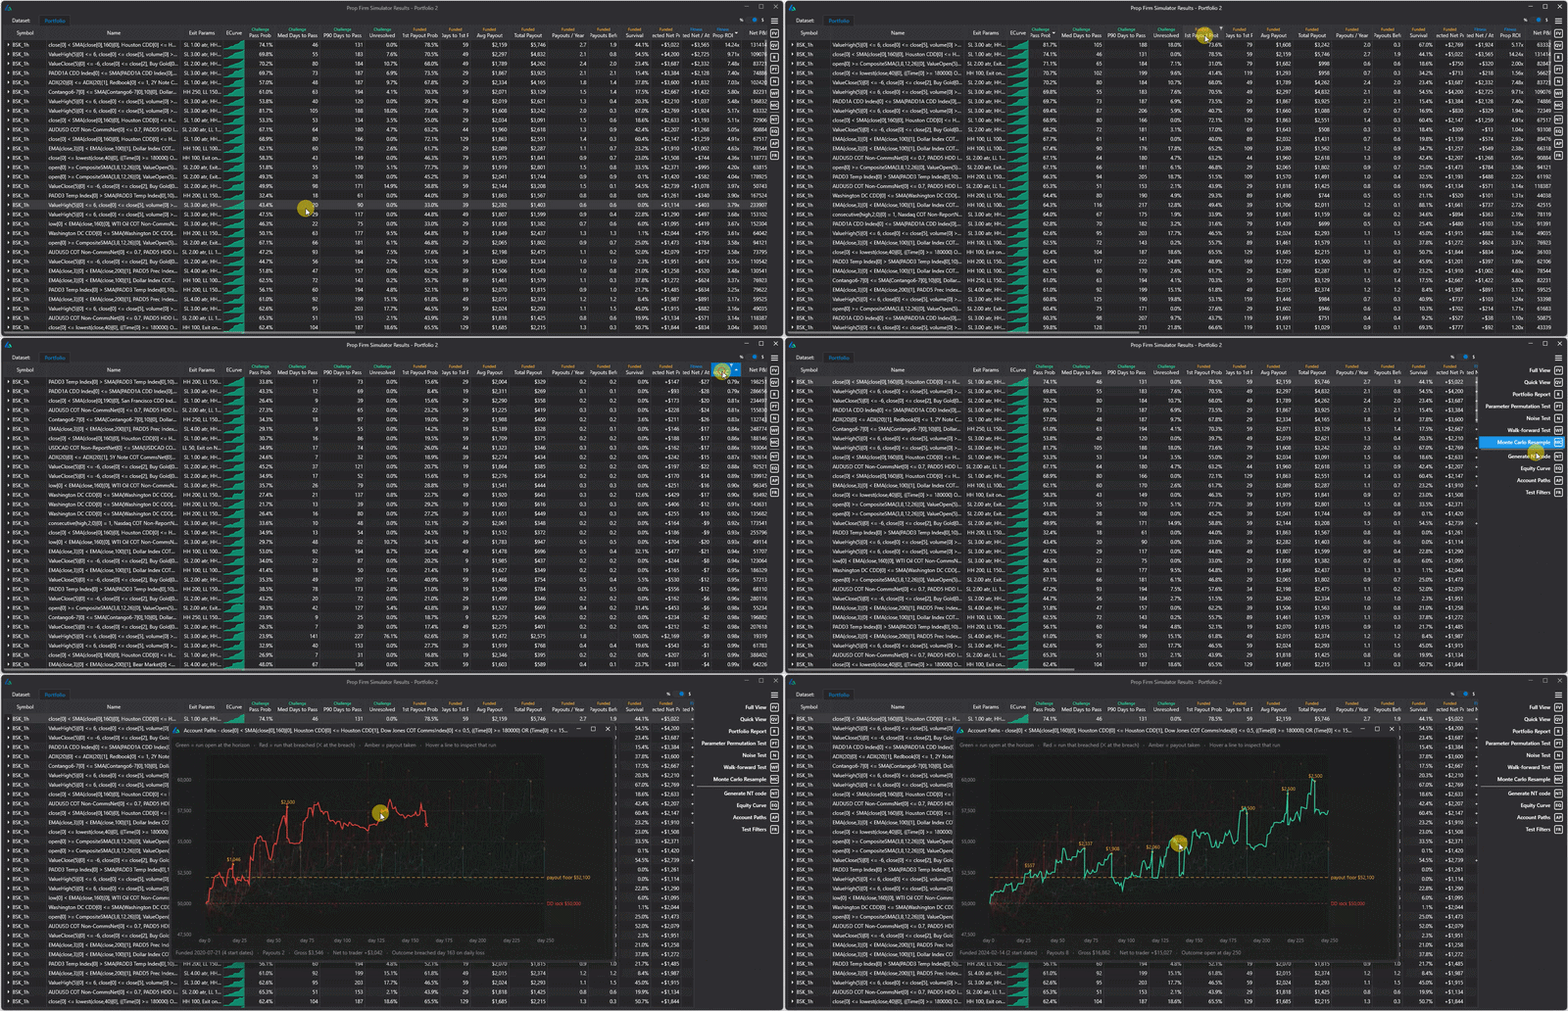
In this short clip, I sort by Passing Probability then sort by Payout Probability and finally by Expected Net per attempt. Then I open the Account Paths and you can see the hover feature over every path showing.
Challenge Finder: Which Prop Challenge Fits Your Portfolio?
The same portfolio may work for one challenge and be a disaster for another. A drawdown rule one portfolio handles easily can breach it at a different firm, and a payout rule that suits one return stream can starve another. The Challenge Finder, labeled Find Challenges in the software, shows you which is which before you spend a dollar.
Find Challenges is available from the right-hand panel of the Prop Firm Simulator results. Select a portfolio and it runs that portfolio through every prop firm challenge in the database. An active AI agent scans the web and keeps the database updated with the latest prop firm challenges, rules and pricing.
The results rank every challenge in a sortable table, by Expected Net / Attempt by default. Each row shows the firm, program, account size, price and billing, the contract multiplier that fits that challenge best, and the same pass, payout, survival and fitness metrics you see in the simulator. Separate columns flag whether the firm allows automation and overnight holds, the confidence of the rule data and the date the rules were last checked. From there you can:
- View Account Paths for any challenge, for that specific portfolio.
- Use it in the Prop Firm Simulator: load that challenge back into the simulator and search for better portfolios built for that challenge.
- Export CSV to keep the full table.
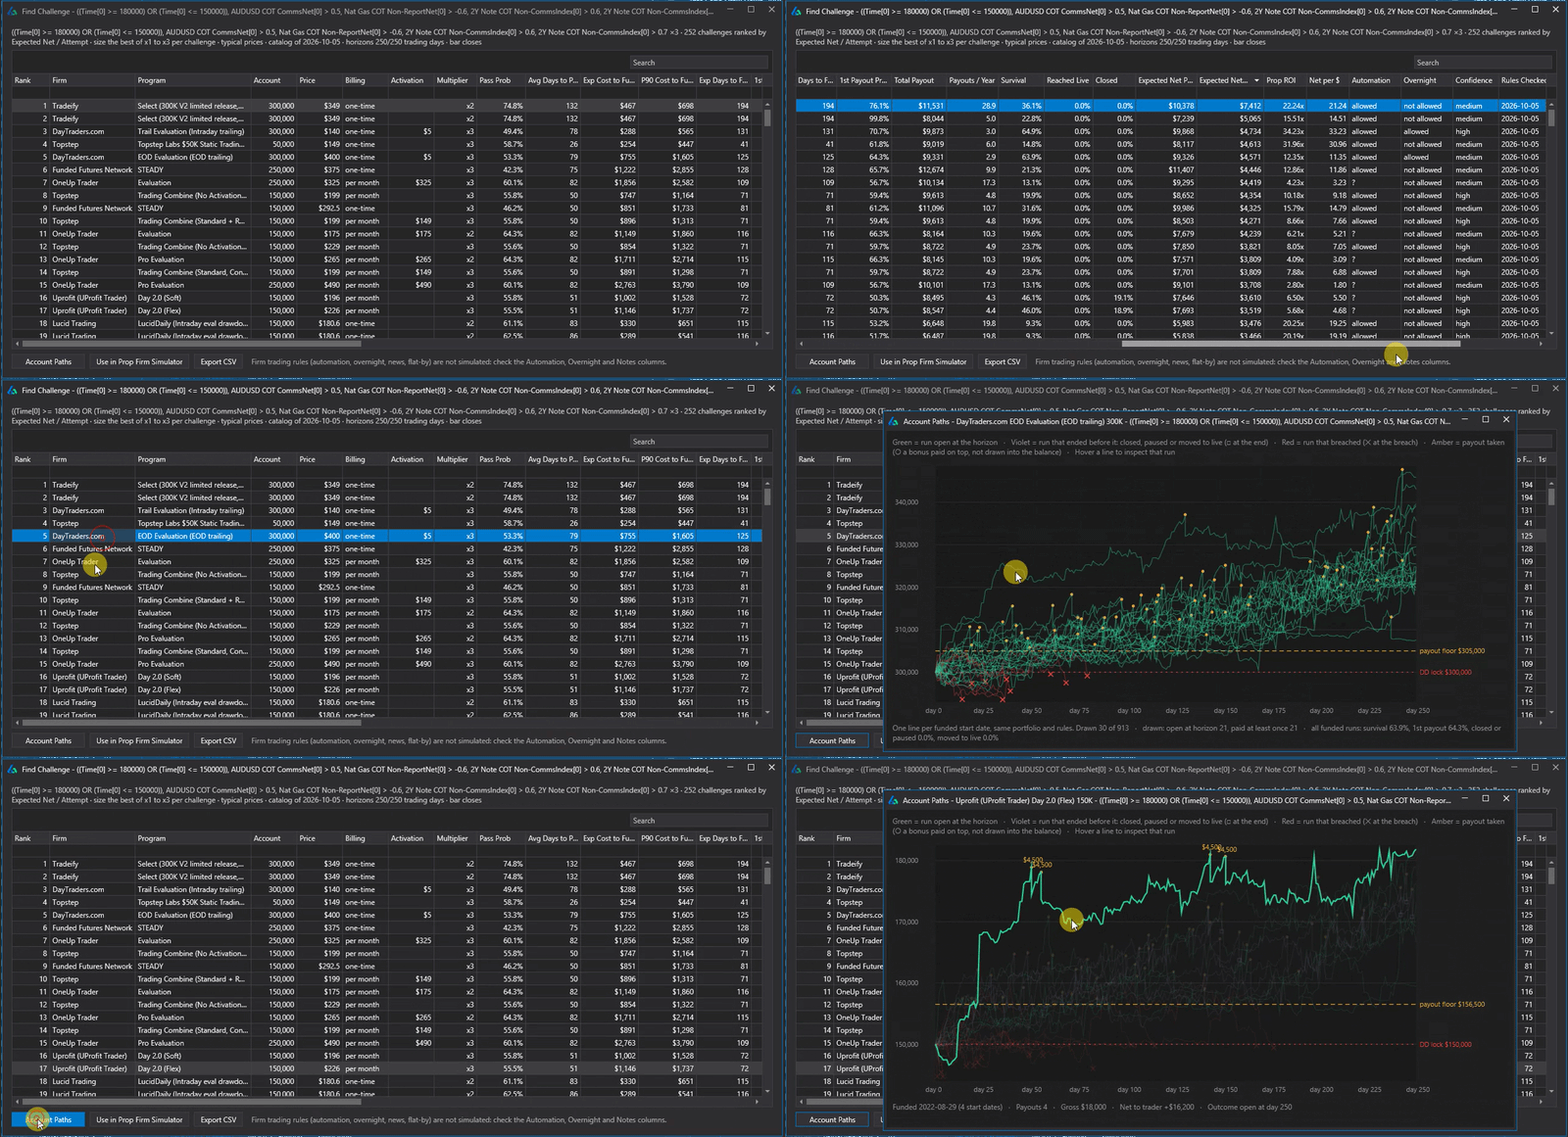
Some firm rules, such as automation, overnight, news and flat-by rules, are not simulated. The table shows them in their own columns and notes, so check those before you buy.
Run This Before You Commit
Run Find Challenges before you commit to a challenge to make sure you're optimizing your spend and your chances at a payout.
Why Start Dates Instead of Monte Carlo Resampling?
Build Alpha users know I like Monte Carlo. So why does the Prop Firm Simulator replay real start dates instead of shuffling trades?
Resampling is still a good follow-on for sample size, but as a block bootstrap of daily P&L, not a trade shuffle. A block bootstrap resamples runs of consecutive days, so it keeps some of the clustering a trade shuffle destroys.
| Method | Calendar rules | Loss clustering | Sample size |
|---|---|---|---|
| Start-date replay | Kept | Kept | Limited by overlap |
| Trade-shuffle Monte Carlo | Lost | Lost | Large |
| Block bootstrap of daily P&L | Within blocks | Partly kept | Large |
That overlap is why the Challenge metrics include Independent Episodes. A start date and the next day's start date share almost the entire path, so their results are not independent. Independent Episodes tells you how much evidence the start dates really hold.
Prop Firm Rules Carry Into Your Live Trading Code
A simulation is only useful if live trading follows the same rules. When you generate code from Build Alpha, the prop firm logic passes into the strategy code:
- Maximum counts. The contract limits you simulated, enforced at order time.
- Stacking positions. Whether a strategy can add to a position it already holds.
- Group stacking. Stacking limits across custom symbol groups you define, so related markets are treated as one exposure.
- Sizing. The same fixed contracts and multiplier the simulation used.
Your live account then trades with the constraints that produced the results you selected, not a set of rules you tried to remember. If you trade prop accounts through NinjaTrader, see Build Alpha for NinjaTrader.
What a Prop Firm Simulator Cannot Tell You
A prop firm simulator asks a better question. It is not a crystal ball. Keep these limits in mind:
- History is one sample. Start dates replay the past from many entry points, but it is still one past. Validate the strategies first with tests like the Noise Test and Vs Random.
- You can overfit the rules. Searching thousands of portfolios for the best Expected Net / Attempt can fit noise in one rule set. Prefer portfolios that hold up across nearby settings and different date ranges.
- Rules change. A rule set file is only as current as the day you saved it.
- Costs and fills. The simulation inherits your backtest's cost assumptions, so set realistic commissions and slippage before trusting the payout numbers.
- Rules no backtest can model. Some firm policies, such as news-trading restrictions or account activity reviews, cannot be simulated yet. News events coming in phase 2. You can add rules in BA to avoid.
- Overlapping start dates. A thousand start dates are not a thousand independent trials. Check Independent Episodes.
- Fixed size by design. The simulator does not compound. If you plan to add contracts as an account grows, test that separately or with Build Alpha's Portfolio Suggest simulator.
For a quick sanity check outside Build Alpha, the free risk of ruin calculator estimates how likely a strategy is to hit a loss limit, and the Monte Carlo simulator shows the spread of drawdowns a trade list can produce.
Takeaways
✓ Key Takeaways
- In a prop account, your cash flow is not your strategy's P&L. The fee caps your loss
- Passing is not getting paid. In the example, 59% pass but only 35% collect a payout
- Rank portfolios by expected cash per attempt after all fees, not pass rate or backtest profit
- Payout gates like qualifying days, caps and consistency must be modeled with the drawdown rules
- Focus on positive-expectancy strategies whose tails are too costly for personal capital
💡 Need to Know
- EV per attempt = P(pass) × P(paid | pass) × avg payout − expected fees
- Build Alpha replays real start dates bar by bar, so time-based rules run on real days
- Fixed contracts, no compounding. Micros count 0.1 toward the contract limit
- Account Paths shows every funded start date, with payouts and breaches
- The prop rules carry into generated code for live trading
Prop Firm Simulator FAQ
Summary: Optimize for the Payout, Not the Pass
Prop firms change the math of strategy development. Your cash flow is the fee you pay and the share of profit you withdraw, not the strategy's P&L, and the gap between passing and getting paid is where most of the value is captured. The right question is which portfolio produces the most expected cash after all fees.
I built the Prop Firm Simulator because Build Alpha users kept asking for it, and because that question cannot be answered with a normal backtest. Build a broad pool of strategies, let the simulator assemble the portfolios the rules actually pay, check the paths, and take the same rules into your live code. If you have questions or ideas for prop firm features, email me anytime.


David Bergstrom
The guy behind Build Alpha. I have spent a decade-plus in the professional trading world working as a market maker and quantitative strategy developer at a high frequency trading firm with a Chicago Mercantile Exchange (CME) seat, consulting for hedge funds, CTAs, family offices, and RIAs. I am a self-taught programmer utilizing C++, C#, and Python with a statistics background specializing in data science, machine learning, and trading strategy development. I have been featured on Chatwithtraders.com, Bettersystemtrader.com, Desiretotrade.com, Quantocracy, Traderlife.com, Seeitmarket.com, Benzinga, TradeStation, NinjaTrader, and more. Build Alpha is the culmination of a repeatable process to find, create, test, and implement algorithmic trading ideas in a robust manner.
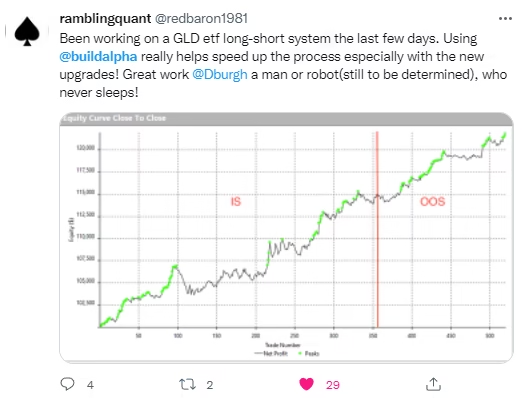
What Traders Say About Build Alpha













Explore More
Optimize for the Payout, Not the Pass
Replay any portfolio through challenge and funded rules from every start date, rank it by expected cash per attempt, and export the rules into your code. No coding required.