One Portfolio, 502 Prop Firm Challenges:
What the Data Shows
I ran one portfolio of futures strategies through 502 prop firm challenges from 22 firms. The same trades were worth anywhere from +$27,822 to −$2,883 per attempt, depending on which challenge they were placed in.
The Short Answer
One portfolio of intraday futures strategies was simulated against 502 prop firm challenges. The median challenge was worth $2,349 per attempt after all fees. The best was worth $27,822 and the worst lost $2,883. The best challenge did not have the highest pass rate: 134 evaluations had a higher one. Payout rules, account size and fees moved the result as much as the odds of passing.
- What I Tested
- Finding 1: The Same Portfolio Is Worth $27,822 or −$2,883
- Finding 2: The Highest Pass Rate Is Not the Best Challenge
- Finding 3: Payout Rules Can Halve the Result
- Finding 4: Small Accounts Were the Worst Value
- Finding 5: Monthly Fees Cost Four Times More to Get Funded
- Finding 6: The Firm Matters Less Than the Challenge
- Finding 7: The Same Trades, a Fraction of the Capital at Risk
- Which Rule Ended the Most Runs?
- What This Study Does Not Tell You
- Run It on Your Own Portfolio
- FAQ
What I Tested
Most prop firm comparisons list rules and prices side by side. That tells you what each firm charges and allows. It does not tell you how a real set of trades behaves under those rules. So I took one portfolio and ran it through every challenge I could.
- The portfolio. One portfolio of automated intraday futures strategies built in Build Alpha. Every strategy is flat before the close each day, so nothing is held overnight. Which strategies are inside is not important for this demonstration. What matters is that the same trades went into every challenge.
- The challenges. 502 challenges from 22 futures prop firms, using the rules and prices on file as of November 11, 2026. Challenges that prohibit automated trading were left out.
- The method. Build Alpha's Challenge Finder replays the portfolio through each challenge's evaluation and funded-account rules from every historical start date, then applies that challenge's fees.
- The yardstick. Expected Net / Attempt: what one purchase of the challenge is worth on average, counting payouts actually received minus every fee. Failed attempts count as losses of the fee.

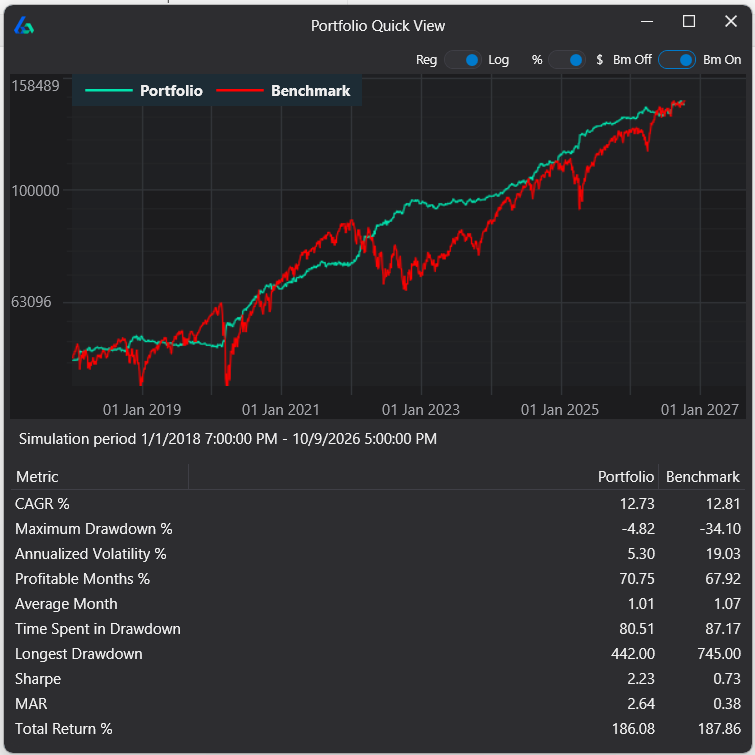
Over that period the portfolio returned 12.7% a year. Its maximum drawdown was 4.8%, with a Sharpe ratio of 2.23. The buy-and-hold benchmark returned about the same, 12.8% a year, but with a 34.1% drawdown. Even with a curve this steady, the challenge chosen changed the result by more than $30,000 per attempt.
Of the 502 challenges, 431 are evaluations the portfolio has to pass. The other 71 are instant-funding accounts with no evaluation, so their pass rate is 100% by definition.
Finding 1: The Same Portfolio Is Worth $27,822 or −$2,883
Nothing about the portfolio changed between rows. Only the challenge did. The spread between the best and worst challenge was more than $30,000 per attempt.
| Expected Net / Attempt | Result |
|---|---|
| Best challenge | $27,822 |
| Top quarter starts at | $5,239 |
| Median challenge | $2,349 |
| Bottom quarter ends at | $746 |
| Worst challenge | −$2,883 |
| Challenges with a positive result | 472 of 502 |
| Challenges worth $10,000 or more | 33 of 502 |
| Challenges worth under $1,000 | 159 of 502 |
A trader who picked a challenge at random would most likely land near the median, at about one twelfth of what the best challenge paid. Nearly one in three challenges was worth less than $1,000 per attempt, and 30 were worth nothing or lost money.
The worst challenge is worth a second look. The portfolio passed it 75.6% of the time, almost the same as the best challenge at 76.9%. It still lost money, because of what happened after the pass.
Here is the full spread. Each bar counts the challenges that landed in a $2,500 range. Most sit just above zero, 30 lost money, with a single challenge out at $27,822.
Finding 2: The Highest Pass Rate Is Not the Best Challenge
The best challenge had a 76.9% pass rate. 134 evaluations had a higher one, and every one of them paid less.
The evaluation with the highest pass rate was a $150K account that the portfolio passed 85.5% of the time. It was worth $4,475 per attempt and ranked 144th of 502. That is about one sixth of the best challenge.
Pass rate still matters. It works as a floor, not as a ranking:
- Low pass rates were poor value. The quarter of evaluations with the lowest pass rates (54% and under) had a median of $240 per attempt.
- High pass rates were better, but not best. The quarter with the highest pass rates (78% and up) had a median of $5,179. The single best challenge sat just below that group.
- Instant funding did not win. The 71 instant-funding accounts skip the evaluation, yet their median was $1,960 per attempt against $2,585 for evaluations.
Why a Pass Is Not a Payout
Passing only gets you a funded account with a second set of rules. What you keep depends on whether the account survives those rules long enough to pay out, how much each payout is allowed to be, and what the attempts cost. The full math is in the Prop Firm Simulator guide.
Finding 3: Payout Rules Can Halve the Result
Two challenges with the same account size, the same price and the same pass rate were worth $27,822 and $14,971. The only difference was the payout path chosen at checkout.
| Same firm, same program | Price | Pass rate | Expected Net / Attempt |
|---|---|---|---|
| $300K, daily payout path | $367.50 | 76.9% | $27,822 |
| $300K, flex payout path | $367.50 | 76.9% | $14,971 |
| $150K, daily payout path | $258.30 | 76.9% | $11,394 |
| $150K, flex payout path | $258.30 | 76.9% | $5,183 |
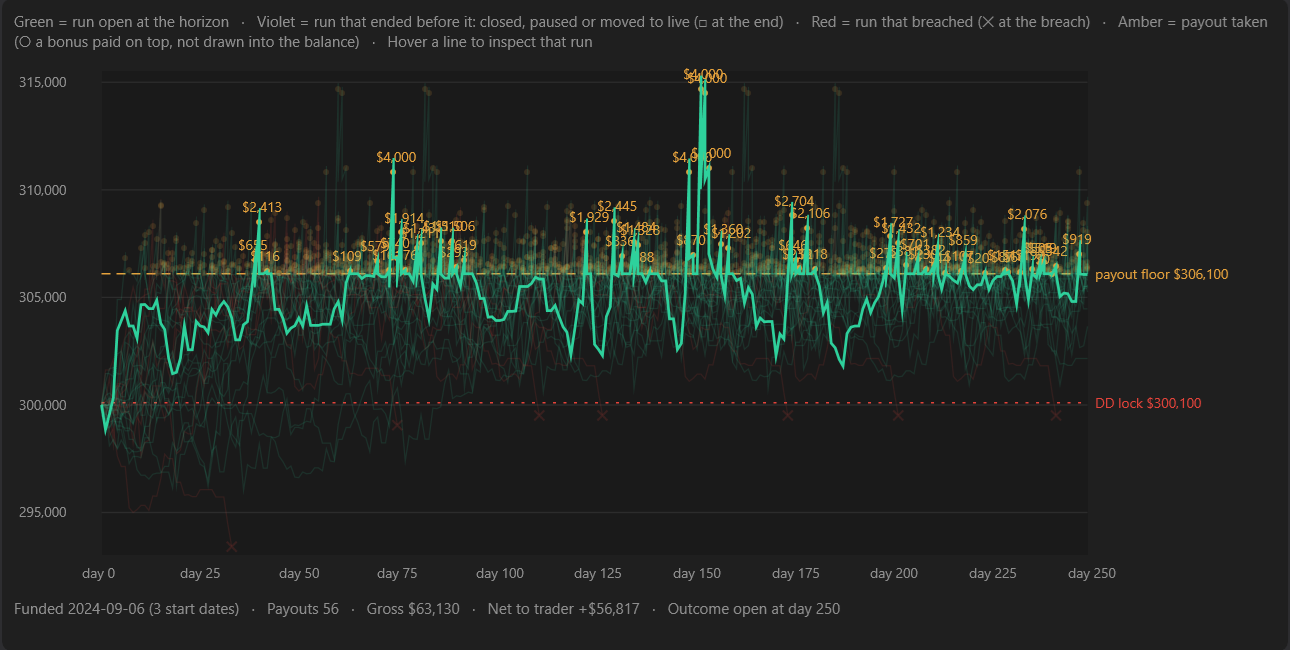
For this portfolio, the daily path paid roughly twice as much at both account sizes. A different portfolio with a different return pattern could come out the other way. The point is that a checkbox most traders choose in a few seconds was worth more than $12,000 per attempt here, and no price list shows that.
Finding 4: Small Accounts Were the Worst Value
The median $25K challenge was worth $616 per attempt. The median $150K challenge was worth $4,270.
The extra cost was small next to the extra value. The median $25K challenge was priced at $74.50 and the median $150K challenge at $240.64. That is about $166 more for a median result about $3,650 higher.
Bigger was not always better. The $200K and $300K groups came in below the $150K group. Larger accounts allow larger position sizes, but they also come with their own drawdown and payout rules, and those did not always suit this portfolio.
Finding 5: Monthly Fees Cost Four Times More to Get Funded
Challenges billed monthly had a median expected cost to get funded of $1,177. One-time fee challenges had a median of $269.
| Billing | Challenges | Median cost to fund | Bad-case cost to fund |
|---|---|---|---|
| One-time fee | 345 | $269 | $402 |
| Monthly fee | 86 | $1,177 | $1,918 |
| Instant funding | 71 | $473 | $473 |
Cost to fund counts every fee paid until the account is funded, including failed attempts and extra months. The bad-case column is the 90th percentile: one attempt in ten cost more than that.
The median challenge took this portfolio about 117 days to get funded, so a monthly fee was paid several times over. Monthly billing was not a deal-breaker, though. Two of the three best challenges in the study bill monthly. They cost more to reach, and paid enough to cover it.
Finding 6: The Firm Matters Less Than the Challenge
At 18 of the 22 firms, the firm's best challenge was worth at least twice its median challenge. Choosing a firm and then picking one of its challenges by price or account size leaves most of the value on the table.
The ten best challenges for this portfolio:
| Firm | Program | Account | Price | Pass rate | Net / Attempt |
|---|---|---|---|---|---|
| Tradeify | Select 300K, Daily payout path | $300K | $367.50 | 76.9% | $27,822 |
| OneUp Trader | Evaluation | $250K | $325 /mo | 71.0% | $20,377 |
| OneUp Trader | Pro Evaluation | $250K | $490 /mo | 71.0% | $19,267 |
| Lucid Trading | LucidDaily EOD eval drawdown, DLL Off, 50% consistency add-on | $150K | $220.50 | 78.5% | $17,910 |
| Lucid Trading | LucidDaily EOD eval drawdown, DLL On, 50% consistency add-on | $150K | $220.50 | 78.5% | $17,910 |
| MyFundedFutures | Rapid Plan Intraday trailing sim funded | $150K | $277.80 | 77.0% | $17,853 |
| Lucid Trading | LucidDaily Intraday eval drawdown, DLL Off, 50% consistency add-on | $150K | $180.60 | 76.5% | $17,339 |
| Lucid Trading | LucidDaily Intraday eval drawdown, DLL On, 50% consistency add-on | $150K | $180.60 | 76.5% | $17,339 |
| OneUp Trader | Evaluation | $150K | $175 /mo | 78.5% | $17,047 |
| OneUp Trader | Pro Evaluation | $150K | $265 /mo | 78.5% | $16,399 |
And the range inside each firm:
The same figures as a table:
| Firm | Challenges | Best | Median | Worst |
|---|---|---|---|---|
| Tradeify | 26 | $27,822 | $5,102 | $581 |
| OneUp Trader | 10 | $20,377 | $12,038 | $3,416 |
| Lucid Trading | 36 | $17,910 | $4,427 | $595 |
| MyFundedFutures | 18 | $17,853 | $2,111 | $63 |
| Upcomers Futures | 93 | $14,882 | $3,489 | $51 |
| Atlas Funded Futures | 36 | $13,615 | $4,639 | $616 |
| DayTraders.com | 18 | $13,397 | $3,713 | −$449 |
| FTMO Futures | 6 | $9,692 | $4,847 | $3,068 |
| Topstep | 33 | $9,198 | $3,724 | $968 |
| Futureify (formerly FXIFY Futures) | 7 | $6,884 | $1,165 | $518 |
| BrightFunded Futures | 48 | $5,405 | $1,599 | $28 |
| BluSky Trading | 15 | $4,967 | $2,113 | −$102 |
| TradersYard | 8 | $4,475 | $2,025 | $261 |
| Bulenox | 24 | $4,257 | $360 | −$111 |
| Funded Futures Network | 20 | $3,863 | $1,532 | $467 |
| FundedNext Futures | 13 | $2,975 | $2,074 | $553 |
| The Trading Pit | 5 | $2,687 | $1,480 | $623 |
| Legends Trading | 7 | $2,377 | $482 | $111 |
| TradeDay | 12 | $1,585 | $13 | −$410 |
| Traders Launch | 21 | $1,167 | $280 | $94 |
| Earn2Trade | 14 | $160 | −$159 | −$2,883 |
| Blueberry Futures | 8 | $145 | −$16 | −$192 |
Both tables leave out 24 challenges that had no price on file when the study was run. Every figure is for the one portfolio tested. A firm near the bottom of this list could be near the top for a different portfolio.
Finding 7: The Same Trades, a Fraction of the Capital at Risk
Traded with its own capital, this portfolio turned $1 into about $2.86 in almost nine years. In the best challenge, every $1 of fees returned an expected $76.70 in payouts.
That second number is Prop ROI: trader payouts per attempt divided by cost per attempt. It is the reason traders buy challenges at all.
| Same portfolio | Own account | Best challenge | Median challenge |
|---|---|---|---|
| Money you put up | The full account | $478 expected cost to get funded | Fees only |
| Result | 186% total return, 12.7% a year | $27,822 expected net per attempt | $2,349 expected net per attempt |
| Return on money put up | 2.86x in almost nine years | 76.7x per attempt | 9.8x per attempt |
Prop ROI was above 1x, meaning payouts exceeded costs, in 448 of the 478 challenges that had a price on file. It was 50x or more in 30 of them.
The trades did not get better. The portfolio earns the same profit per contract in either account. What changes is how much of your own money has to be at risk to collect it.
These Two Returns Are Not the Same Kind of Number
The own-account return is compounded on capital you keep. Prop ROI is one attempt's payouts divided by its fees. It does not compound, payouts are limited by the firm's rules, the account can be closed, with every payout depending on the firm paying it. Read the comparison as capital at risk, not as a higher return on the same trades.
It also sharpens the main result. Measured on fees alone, the same portfolio lost money in the worst challenge yet returned 76.7x in the best. Only the challenge changed.
Which Rule Ended the Most Runs?
For this portfolio it was the maximum drawdown. The daily loss limit and consistency rules barely mattered.
The portfolio failed about 35% of evaluation attempts on average. To isolate each rule, I compared challenges that are identical except for that one rule.
- Consistency rules ended none. In every evaluation here that has one, breaking the consistency rule does not fail the account. It keeps the evaluation open until your best day is back within the limit. Across 12 matched pairs, loosening the rule to 50% (up from 40%) raised the pass rate by about half a point.
- The daily loss limit rarely bound. Across 38 matched pairs, the same challenge with the daily loss limit on and off had an identical pass rate in 23. The median difference was zero.
- That leaves the maximum drawdown. Challenges with an end-of-day trailing drawdown were passed 70.8% of the time on the median, intraday trailing 68.7%, static 53.5% (13 challenges).
This is a result for one portfolio, and a steady one: it is flat by the close and its worst drawdown was 4.8%. A portfolio with bigger daily swings would hit a daily loss limit far more often, and one that makes most of its profit in a few days would spend much longer stuck behind a consistency rule.
What This Study Does Not Tell You
- It is one portfolio. These rankings belong to this portfolio's trades. Yours have different losing streaks, different best days and a different pace, so they will rank the same challenges differently.
- It is not a ranking of firms. Nothing here says one firm is better than another in general. It says which rule sets and prices suited one set of trades.
- It is a snapshot. Firms change rules and prices often. The data is as of November 11, 2026.
- It is a simulation. Results are hypothetical and based on historical trades. Past performance does not guarantee future results, and live trading adds slippage, outages and human decisions that a backtest does not.
Run It on Your Own Portfolio
The study took one click. In Build Alpha, open the Prop Firm Simulator results, select a strategy or portfolio and choose Find Challenges. It runs that portfolio through every challenge in the database and ranks them by Expected Net / Attempt. As of this writing the database holds 800+ active challenges from 42 futures prop firms.
- See how it works on the Challenge Finder page.
- Read the method behind pass, payout and expected cash per attempt in the Prop Firm Simulator guide.
- Ask an AI assistant to run it for you with Build Alpha MCP.
With Build Alpha MCP connected, you can hand the whole workflow to an AI assistant in one message. For example:
Prop Firm Challenge Study FAQ
Summary
One portfolio, 502 challenges, and a spread of more than $30,000 per attempt. The best challenge was not the cheapest, the largest or the easiest to pass. It was the one whose drawdown rules, payout rules and fees happened to fit this portfolio's trades. The only way to find that challenge for your own trading is to test your own trades against each one, which is what the Challenge Finder does.


David Bergstrom
The guy behind Build Alpha. I have spent a decade-plus in the professional trading world working as a market maker and quantitative strategy developer at a high frequency trading firm with a Chicago Mercantile Exchange (CME) seat, consulting for hedge funds, CTAs, family offices, and RIAs. I am a self-taught programmer utilizing C++, C#, and Python with a statistics background specializing in data science, machine learning, and trading strategy development. I have been featured on Chatwithtraders.com, Bettersystemtrader.com, Desiretotrade.com, Quantocracy, Traderlife.com, Seeitmarket.com, Benzinga, TradeStation, NinjaTrader, and more. Build Alpha is the culmination of a repeatable process to find, create, test, and implement algorithmic trading ideas in a robust manner.
Explore More
Find Your Best Challenge, Before You Pay
Run your own strategy or portfolio through every futures prop firm challenge in the database and rank them by expected cash per attempt. No coding required.