Randomized Out-of-Sample:
Don't Be Fooled by a Trendy OOS Period
Standard OOS testing can produce false confidence when the holdout data is bullish or bearish. Randomized OOS creates 1,000 non-continuous holdout periods to eliminate trend bias and reveal whether your strategy, or the market regime, drove the results.
What Is Out-of-Sample Testing?
Out-of-sample testing means purposely withholding data from your dataset for later testing. For example, with ten years of data you might designate the last 30% (3 years) as out-of-sample. You build and optimize strategies using only the first 7 years (in-sample), then test on the withheld 3 years.
If the strategy still performs well on this unseen data, it suggests robustness, increased confidence it will stand the test of time. For a full deep-dive, see the Out-of-Sample Testing Complete Guide and How the Human Adds Value to OOS Design.
The Pitfall: Trend Bias in OOS Data
There is a major pitfall. What if your amazing long-only strategy only passed OOS because the last 30% of data was extremely bullish? Is it possible any long strategy would have passed this period?

Any long strategy passes this OOS period, the trend, not the strategy, drives the result.

Moving OOS to the start doesn't help if that period also has a strong trend.
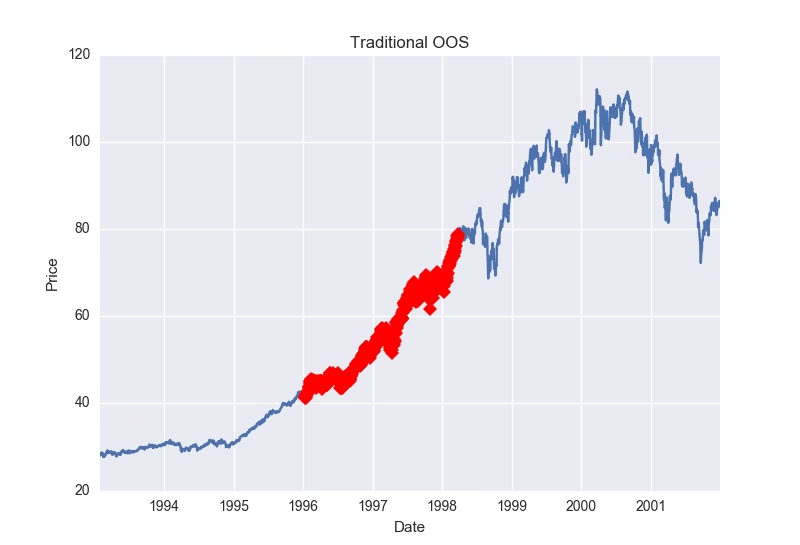
Any continuous 30% block risks containing a dominant trend or regime.
⚠️ The Core Problem
No matter where you place a continuous OOS block, end, start, or middle, you risk selecting a period dominated by a trend or regime that artificially inflates (or deflates) your strategy's apparent OOS performance. The solution: make the OOS period non-continuous.
The Solution: Randomized Out-of-Sample
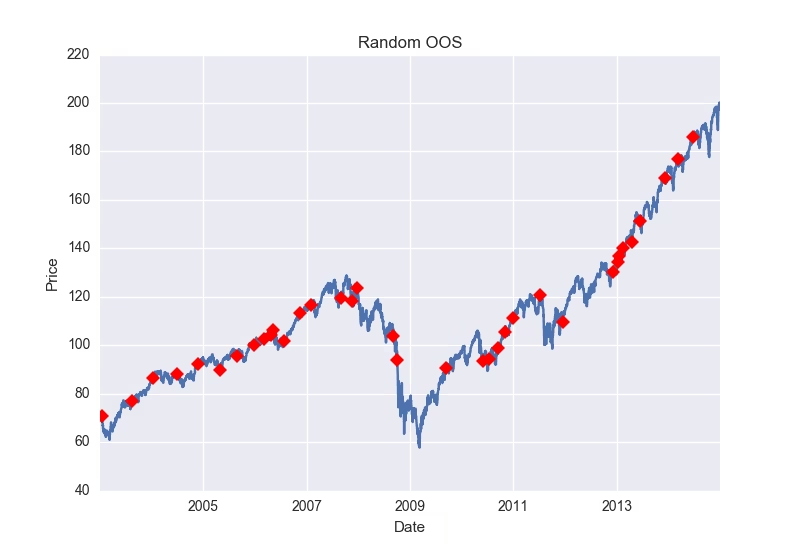
Instead of using a continuous block, randomly select 30% of the dates from the entire dataset to serve as OOS. These dates are scattered throughout the timeline, no longer forming a continuous block that could be dominated by a single trend.
Randomly Select Dates
Pick 30% of all dates at random from the entire dataset. This becomes the "randomized out-of-sample" period.
Split the Trades
Run the full backtest, then filter: trades on non-selected dates = in-sample; trades on selected dates = randomized OOS.
Repeat 1,000 Times
Re-select a new random 30% each time. Some runs will randomly create favorable regimes, others unfavorable, giving a full distribution.
Evaluate the Distribution
Where does your original backtest's OOS equity curve fall within the 1,000 randomized OOS curves?

🔁 Why 1,000 Runs?
One random OOS test is not enough. You might accidentally create a favorable regime through random selection. Running 1,000 iterations ensures the distribution covers a wide range of market conditions, giving you statistical confidence in the results.
Five Random Selections
Below are five different random selections of 30% OOS dates. Notice how each creates a unique distribution of holdout data across the timeline:



Build Alpha's 3-Panel View
Build Alpha runs this entire process with a single click and displays results in three panels:
Interpreting Results: Pass vs. Fail
The key question: where does the thick blue line (your original OOS) sit within the distribution of 1,000 randomized OOS curves?
Original backtest's OOS is at the very top of the distribution. The underlying data contributed favorably, the trend, not your strategy, drove the OOS success. Most likely, the OOS period was heavily bullish (or aligned with your strategy's direction).

Original backtest's OOS falls in the middle of the distribution. Some random OOS periods did better, some did worse. This means the original OOS period was a fair assessment period, the favorable results come from the strategy itself, not the market regime.

💡 Don't Forget the Bottom
If your original OOS line is one of the worst performers compared to the randomized curves, the original OOS period may be overly unfavorable. Throwing the strategy away based on a pessimistic OOS alone may be ill-advised, the randomized test reveals this.
Integrating with Other Robustness Tests
Randomized OOS is one piece of a complete robustness testing workflow. Combine with:
Standard OOS for baseline holdout → Randomized OOS to verify the holdout wasn't biased → Noise Test for volatility sensitivity → Monte Carlo for drawdown risk → Walk-Forward for parameter stability → Vs Random for statistical significance → Synthetic Data for multi-path training.
Build Alpha's automated workflows can chain these tests together, set your pass/fail criteria and only see strategies that survive everything.
Takeaways
✓ Key Takeaways
- Standard OOS can fool you when the holdout period is dominated by a trend or regime
- Randomized OOS scatters holdout dates across the entire timeline, eliminating trend bias
- Run 1,000 iterations to build a distribution, one random OOS test is not enough
🔥 Need to Know
- Blue line at the top = overly optimistic OOS period (trend drove results)
- Blue line in the middle = fair OOS period (strategy drove results)
- Blue line at the bottom = overly pessimistic OOS period (don't discard too quickly)
Randomized OOS FAQ
Related Deep Dives

David Bergstrom
A decade-plus in professional trading as a market maker and quantitative strategy developer at a high-frequency trading firm with a CME seat. Self-taught C++, C#, and Python programmer specializing in data science, machine learning, and trading strategy development.
What Traders Say About Build Alpha















Test on Fair Data, Not Lucky Data
1,000 randomized OOS periods. One-click analysis. Eliminate trend bias before risking capital.