Why Do Automated Trading Strategies Fail?
In my decade-plus of professional trading experience, research effort, and working with thousands of individual traders, consulting for hedge funds, registered investment advisors, Commodity Trading Advisors, and family offices, I have discovered that algorithmic trading strategies fail for two primary reasons or errors and out of sample testing can help.
- Algo strategies are often built for one market environment
- Algo strategies are overfit to the historical data (overoptimized)
In this post, we will take a deep dive into how out of sample testing (OOS) can be an excellent approach to combating both of these algo trading pitfalls, remove some uncertainty, increase knowledge, and help estimate better forecasts.
What is Overfitting? What is Curve Fitting?
Curve-fitting, or more commonly referred to as overfitting, is creating a model that too “perfectly” fits your sample data and will not generalize well on new unseen data. In trading, this is a trading strategy that trades the historical data too well and will fail to adapt to new live data (large forecast error). Not the answer we need.
That is, the strategy has memorized the historical data values finding random, spurious patterns that will fail to repeat in new data. Developing your own trading idea, price forecasting, data mining or using machine learning models can all lead to overfitting.
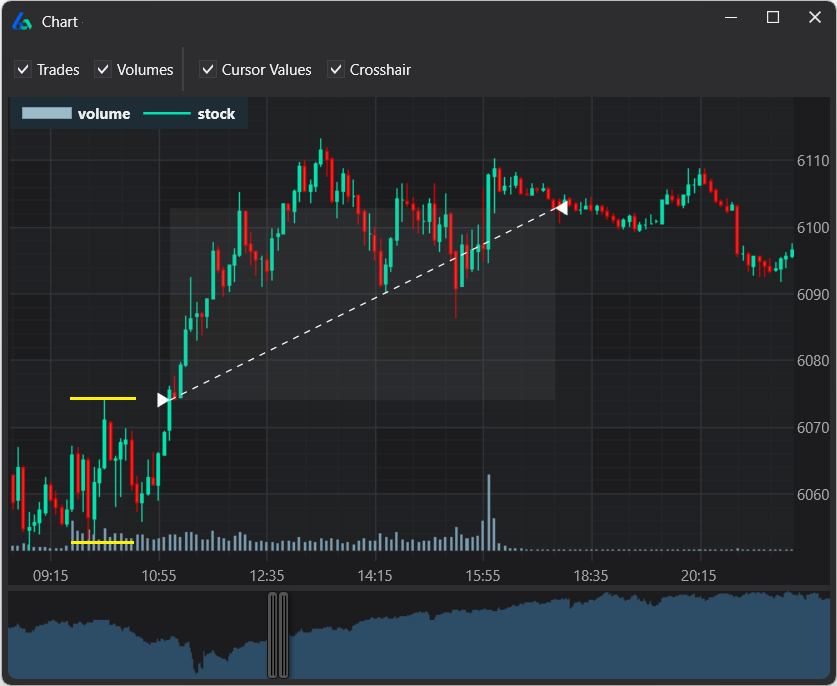
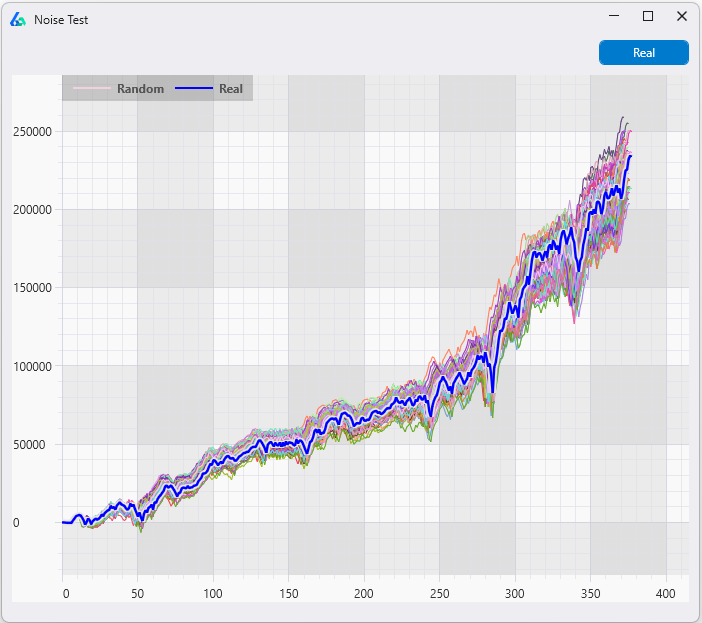
Here are two visuals I found to help illustrate this idea of curve-fitting.


A curve-fit trading system is a trader’s worst nightmare; that is, a trading system that looks great while testing but fails miserably once live. The trading system simply memorized the historical data’s noise and will struggle to predict the noise of new market data.

It is very unlikely the next set of (live) data points will make a milk saucer for the cat in the above photo. Drawing the cat is overfitting the data and poor analysis. It is seeing something that is not really there. A trading strategy that sees price anomalies that are not there will struggle in live trading. OOS testing can help detect overfitting and discover robust trading strategies.
What is a Robust Trading Strategy?
A robust trading strategy is one that is adaptable to changing markets and data conditions. A fragile or overfit trading strategy is one that needs the exact data from the historical period to continue performing as expected which we know the market will not give us.
It is very unlikely that the fragile trading system will help us reach our trading goals. All algorithmic traders strive for robust trading strategies; that is, automated trading systems that have a high probability of performing as expected no matter what the market does.

Finding robust trading strategies is my passion. I took the time to write an in-depth guide on professional stress tests and checks (including OOS) that can help aid in this pursuit here: Robustness Testing Strategy Guide. If you are interested in learning how to better test trading algorithms, then I highly recommend giving it a read next. I am sharing organizational knowledge to be frank.
What is Out of Sample Testing?
Out of sample testing method is splitting the historical time series data into two or more data partitions with the idea of withholding some of the historical data to act as a second, unseen test set. The OOS period acts as an estimation period for live trading.
In trading, the strategy developer would split the historical price data into two sections: the in-sample data and the out-of-sample data. He would then build his trading strategy model on the first section of the data, the in-sample data. This is called model fitting or the learning phase. Once pleased with the strategy after making tweaks, optimizations, adding or deleting rules and filters, doing analysis, he is ready to test the strategy on the second section of data, the out-of-sample data.

The OOS data acts as unseen, untouched data that provides an unbiased view of how the strategy may perform on unseen data. This is a close simulation to new live data as an algo trader can hope.
If the strategy was overfit to the in-sample data, then we could detect such overfitting or curve-fitting on the out-of-sample data by noticing a degradation of performance on the out-of-sample test. That is, if we expect an average profit of $200 per trade from the in-sample data but the out-of-sample test shows a negative -$100 loss per trade then we have overfit to the historical data and the strategy is not robust. A large difference between in-sample and out-of-sample performance may indicate an error or bad assumptions.
This blog will cover the details and methods of OOS testing and how it can help combat against overfitting in algorithmic trading strategy development. On the other hand, if you prefer, please take a look at this video version: Out of Sample Testing for Algorithmic Trading.
In Sample Testing vs. Out of Sample Testing
The in-sample data is the portion of data used to develop the initial strategy, run backtests, optimize parameters, make tweaks, add filters, delete rules, etc. The strategy should arrive in its final form using only the in-sample data.
The out-of-sample data is withheld and unused during the strategy development process. After the strategy model is completed, the trader can test the strategy on the OOS data points. It is often said that if the trading model performs similarly in both the in and out of sample period then we can have increased confidence the trading model generalizes well enough to new data points. That is, we have a good estimation or forecast of what to expect live.
Proper Automated trading software should split the test results for you to reference the In-sample, the out-of-sample, and the combined results of a trading model like Build Alpha does.

How Much Out of Sample Data to use?
The default setting most algorithmic traders will use is 70% in-sample period and the last 30% of the historical data reserved for out of sample testing. That is, if the trader has 10 years of historical data, then the first seven years will be used to develop the trading strategy and the remaining three years will be used for OOS.
Other common approaches to in sample vs out of sample splits are to divide the data directly in half with a 50/50 split. The first 50% of the data used for in-sample and the second 50% used for OOS.

However, the test period, OOS location, and the percentage of OOS chosen can be very critical to the trading strategy’s success. I have always heard that good science is often mostly attributable to good experimental design. In the trader’s case, good science would be setting up a proper test by choosing an appropriate test period, OOS location, and OOS percent.
Out of Sample Test Period Selection – How the Human Adds Value
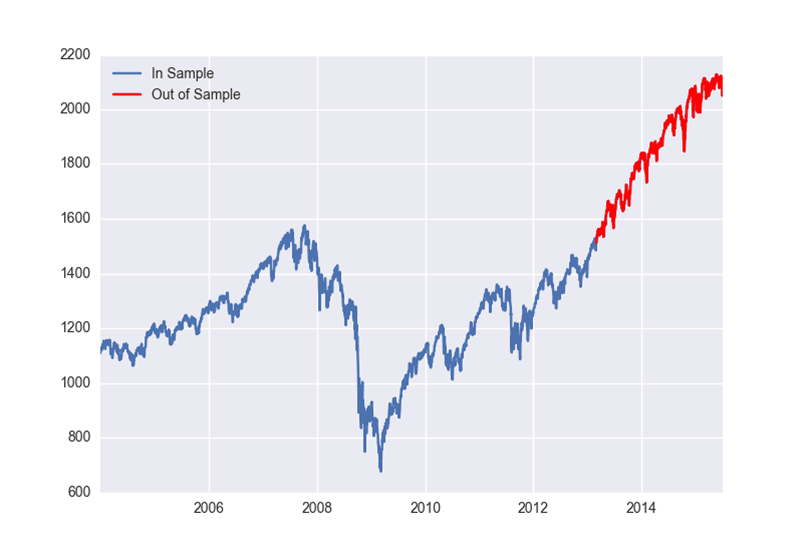
Below is the S&P 500 from 2004 to 2017 with the last 40% of data designated to be OOS (highlighted in red).

We create a trading strategy on the data from 2004 to 2011 – the blue in sample period. However, 2012 to 2017 (red OOS) was largely straight up! If we build a long strategy that avoids most of 2008 via some filter then the strategy may do well on our OOS data, simply because of the bull market.
Did the strategy pass OOS testing or would any strategy have passed this period? The question shows research effort. You can see the importance of intelligently selecting your OOS test period’s location and size.
Let’s use the first 40% of data as OOS. In this case, it allows us to build our strategy on the most recent data (the last 60%) from 2009 to 2017.

Many prefer to build their models on the recent data as it is the most like the live data they will soon experience. They then test out of sample using older data and in our case 2004 to 2008 (the first 40% highlighted red above).
Why 40%? I selected a percentage that would capture the financial crisis. If we build a trading strategy from 2009 to 2017 and then test from 2004 to 2008 and it performs similarly in both periods, then we likely have uncovered persistent edge that generalizes over two unique sets of data.
Selecting out of sample location and percentage is mission critical to better forecasting. Design your test to be as difficult as possible to pass – try to break your system in the testing process. If you do not, then the market will surely break it once you go live!
Out of Sample Selection Improves Trading Strategy Robustness
Testing design and set up is undoubtedly where the human still adds value to the automated trading process. Build Alpha allows users to leverage computational power in system design, validation, and testing; however, the test set-up in BA is still an area where a smarter, more thoughtful trader can capture an edge over his competitors while adding robustness to the output.
Below I have some photos of some terrible experiment design to help drive the point home. Both present fairly simple OOS tests to “pass” and potentially increase the trader’s risk.

The main takeaway is the human can still add value to the automated trading process by proper backtest and experiment design. That is why BuildAlpha software allows the trader/money manager to adjust everything (or nothing) from OOS percent, OOS location, test periods, the minimum number of trades in-sample, and the minimum number of trades OOS.
Randomized Out of Sample Testing – Avoid Luck
Traders are lazy and may not put in the work to find the exact percentage of out of sample data to make their test as difficult as possible to pass. An alternative method is to avoid using a single location for OOS and rather use a randomized selection. Build Alpha software can automatically and randomly select the out of sample period to avoid this common pitfall.
Read more
What are the benefits and pitfalls of Out of Sample Testing?
To explain simply, the main benefits of out of sample testing for algorithmic trading strategy development is a first line of defense against curve fitting and better forecasting performance. That is, out of sample testing helps discard obvious curve fit systems that fail to perform well on unseen historical data. This can save a trader who takes backtest research and immediately goes live with hard earned money only to see the strategy fail immediately. We have all been there.
The pitfall, and an often-missed error, is using an overly optimistic period of data that is too easy to pass. For example, any long strategy should do well in an out of sample period that goes straight up. Being aware of this pitfall, intelligently designing your in and out periods, or using the Randomized Out of Sample test are all ways to combat this and improve your trading research.
Key Takeaways
-
Overfitting first line of defense
out of sample testing can help avoid the avoidable by estimating strategy performance on unseen data. OOS testing simulates live trading.
-
Human can add value
merit to automated trading process by selecting the proper location and size of out of sample data can help create more robust trading models and reliable statistics. Attempt to break your strategies before the market does by designing hard to pass backtests.
-
OOS is rarely enough alone
out of sample testing is a great first step but is not a be all end all. Check out the full Robustness Tests Trading Guide to see the next tests for creating robust trading systems and more accurate expectations.
Need to Know
- Out of sample (OOS) testing splits the historical data prior to a backtest.
- Develop trading systems on the in-sample data first then test the signal OOS
- OOS can be any percentage of the historical data
- OOS can be at the beginning, middle or end of the historical data
- Randomized out of sample selection is a great test to combat strong trending out of sample data and compare model performance across various market conditions
- Algos that pass OOS are a great sign but by no means a complete green light to start live-trading
Out of Sample Testing Summary
Out of sample testing is a research effort and first line of defense to discover overfit and curve fit trading strategies that are destined to fail in live trading. Out of sample testing does not guarantee trading success but can surely help avoid the avoidable. Splitting historical data into a training and testing period allows the trader to properly design, estimate, tweak and optimize a trading system on the in-sample data before doing a final test on the withheld and unseen OOS data. Out of sample testing is the most popular and common stress test for any algorithmic trading strategy. Put this test in your trading toolbox immediately.
Thank you for the professional user contributions “licensed” and to those that share knowledge. That is what makes the Build Alpha community great. I hope you enjoyed this Out of Sample Testing Guide.
Author

David Bergstrom – the guy behind Build Alpha. I have spent a decade-plus in the professional trading world working as a market maker and quantitative strategy developer at a high frequency trading firm with a Chicago Mercantile Exchange (CME) seat, consulting for Hedge Funds, Commodity Trading Advisors (CTAs), Family Offices and Registered Investment Advisors (RIAs). I am a self-taught programmer utilizing C++, C# and python with a statistics background specializing in data science, machine learning and trading strategy development. I have been featured on Chatwithtraders.com, Bettersystemtrader.com, Desiretotrade.com, Quantocracy, Traderlife.com, Seeitmarket.com, Benzinga, TradeStation, NinjaTrader and more. Most of my experience has led me to a series of repeatable processes to find, create, test and implement algorithmic trading ideas in a robust manner. Build Alpha is the culmination of this process from start to finish. Please reach out to me directly at any time.