Stop Losses: Complete Guide
and Test Results Reveal
Fixed dollar, percentage, ATR, and trailing stops, tested across 3 strategies and 8 stop types with real backtest data. Which stop loss works best? The answer will surprise you.
What Is a Stop Loss?
A stop loss is an order to close an existing position to limit losses when the market reaches a certain price. It is a form of risk management that automatically exits a trade when the setup has been invalidated or the trader cannot stomach more pain. The purpose: protect against severe losses before they happen.

How Does a Stop Loss Work?
Cody buys 100 shares of AAPL at $104.00 and does not want to risk more than $200. He sets a stop loss at $102.00. If AAPL falls to that price, his 100 shares are automatically sold, capping his loss at $200.
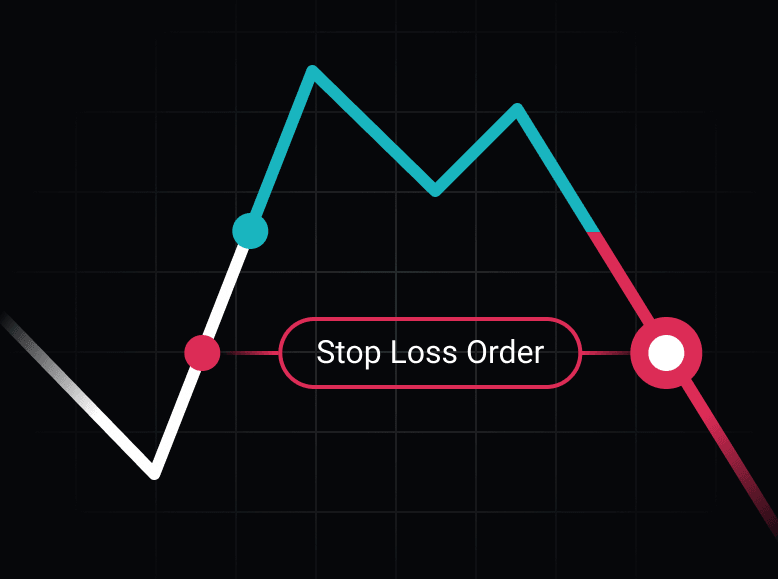
When price reaches the stop, the order converts to a market order and executes at the next available price. If the best bid is $101.98 instead of $102.00, Cody's fill is $0.02 worse, a $202 loss instead of $200. This slippage risk matters in fast markets.
Stop Loss vs. Stop Limit Order
What if the best bid is $101.08 instead of $101.98? With a regular stop loss (market order), Cody sells at $101.08, a much larger loss. What if he'd prefer to wait for price to recover?

Triggers at stop price, executes at next available price. Guaranteed exit, but fill price may be worse than expected in fast markets or overnight gaps.
Triggers at stop price, only fills at limit price or better. Controlled fill price, but order may never execute if price gaps past the limit.
⚠️ Gap Risk
Neither stop type protects against overnight gaps or thinly traded markets. A stock can close at $104 and open at $98, both stop loss and stop limit orders face execution risk in these scenarios. Trading liquid futures contracts can help alleviate some of this concern.
How to Calculate Stop Loss Placement
Where should the stop price go? There are three broad approaches, and the third is the only one we recommend.
Place stop beyond a recent high/low that invalidates the setup. Hard to backtest. We call this the "draw a line stop loss."
Set stop at your personal pain threshold. Problem: the market does not care where your pain threshold is.
Fixed dollar, fixed ATR, dynamic dollar, or rolling N-day low/high. Fully backtestable. This is the way.

What Is a Trailing Stop Loss?
A trailing stop moves in the favorable direction as the trade becomes profitable but never moves backward. It protects against initial losses like a fixed stop, then locks in gains as the trade runs in your favor.

Cody enters at $104.00 with a $1.00 trailing stop (initially at $103.00). AAPL rises to $104.77, the trailing stop moves to $103.77. If AAPL then rises to $105.66, the stop moves to $104.66, above his entry. Cody has locked in gains even if price drops. The trailing stop can update instantaneously or at the end of each bar.
Static vs. Dynamic Stop Losses
✓ Simple to understand and calculate
✓ Always know your exact risk
✗ Ignores changes in volatility
✗ Ignores changes in price level
✓ Wider in high-vol, tighter in low-vol
✓ Adapts to price level changes ($50→$500)
✗ Harder to calculate on the fly
✗ Harder to quickly assess risk

Mean Reversion vs. Trend Following: Do Stops Always Help?
Not always. The answer depends entirely on the strategy type.
When price moves further from the mean, the edge actually increases. A stop loss cuts the trade at peak edge. Backtests commonly show 2× more net profit without stops on mean-reversion systems.
Trend strategies need a short leash for when the trend fails. Without a stop, a single losing trade can erase months of gains. Convex strategies almost always benefit from defined risk.
RSI Strategy: With Stop vs. Without
Here is a popular 2-period RSI strategy tested across SPY, DIA, QQQ, and IWM (buy when 2-RSI crosses above 20, sell when it falls below 80):


🔑 Key Insight
Neither version is great standalone, but the no-stop version doubled net profit. Mean reversion + tight stop = cutting your winner at the worst moment. This does not mean all strategies should avoid stops, the opposite is true for trend-following.
Position Sizing from Stop Distance
The late Dr. Van Tharp wrote extensively about calculating position size based on entry-to-stop distance. His complete guide on position sizing is a must-read. In short:
This method can produce large position sizes, and you may not get filled at exactly $102.00 in fast markets. Build Alpha supports this approach via its "Volatility" based position sizing, which dynamically sizes based on stop distance.
The Test: 3 Strategies × 8 Stop Types
Enough discussion. Let's look at real data. We tested three popular strategies, each with $10,000 per position, backtested 2006 to mid-2022 using Build Alpha.
Five Stop Loss Types
Risk the same dollar amount every trade regardless of underlying price.
Risk the same percentage of position value each trade.
Risk a multiple of Average True Range. Dynamic, widens/narrows with volatility.
Follows price in the favorable direction. Protects gains as the trade runs.
Eight Stop Configurations Tested
Three Strategies
Buy when 2-period RSI crosses above 20, sell when it falls below 80. Mean reversion.
Buy stock index Tuesday after a down Monday. Seasonality-based edge.
Buy when 10-SMA crosses above 50-SMA. Classic trend-following.
Results

🏆 Key Results
The $100 trailing stop was the best performer for both RSI and Turnaround Tuesday, but it was one of the worst for the moving average crossover. There is no universal "best stop." Everything is relative to the strategy and symbols traded. You must TEST EVERYTHING.
There are tons of other variations we could test, combinations of stops, larger stops, smaller stops, time-based exits, and more. That is the beauty of Build Alpha, which allows you to quickly build and test strategies with no code.

Need to Know About Stop Loss Orders
- Stop losses aim to protect traders from significant losses by automatically exiting at a preset price
- A stop loss converts to a market order when triggered; a stop limit converts to a limit order
- Trailing stops follow price in the favorable direction and protect gains as the trade progresses
- Dynamic (ATR-based) stops adjust to volatility; static (fixed dollar) stops are simpler to calculate
- Mean-reversion strategies are often harmed by stops; trend-following strategies almost always benefit
- There is no universal best stop loss, each strategy requires individualized testing
- Position sizing based on stop distance (Van Tharp method) dynamically sizes trades to your risk tolerance
Takeaways
✓ Key Takeaways
- The $100 trailing stop won for 2 of 3 strategies but lost badly on the third, test everything
- Mean-reversion strategies often produce 2× more profit without stops; trend-following needs them
- Dynamic (ATR) stops adapt to changing volatility; static stops are simpler but may become outdated
💡 Need to Know
- Stop loss → market order (guaranteed exit). Stop limit → limit order (price control, no fill guarantee)
- Size positions from stop distance: Risk $ ÷ Stop Distance = shares to trade
- Build Alpha tests all stop types across your strategies with no code, find the optimal exit for each system
Stop Loss FAQ
Related Reading

David Bergstrom
A decade-plus in professional trading as a market maker and quantitative strategy developer at a high-frequency trading firm with a CME seat. Self-taught C++, C#, and Python programmer specializing in data science, machine learning, and trading strategy development.
What Traders Say About Build Alpha















Find Your Optimal Stop
Test every stop type across every strategy. Fixed, trailing, ATR, all compared in seconds with no code.