What does EDGE in trading mean?
In financial markets, trading edge is a temporary advantage over other market participants. Having an edge in trading can exist in many different forms but the two most common are information edge and price edge.
Information edge would be insider trading or material non-public information. For example, knowing a company signed a large deal that will greatly increase revenues before other market participants know would be an information edge.

On the other hand, price edge exists from research and data analysis and is a far more common way to build a trading career. Quantified technical analysis or knowing that prices that reach this level have historically been cheap over the next N days can present a price edge. Renaissance Technologies, the greatest hedge fund of all time, is quoted as saying
“Renaissance essentially attempts to predict the future movement of financial instruments, within a specific time frame, using statistical models. The firm searches for something that might be producing anomalies in price movements that can be exploited. At Renaissance they’re called “signals.” The firm builds trading models that fit the data.” Source: The Secret World of Jim Simons | Institutional Investor

Regardless of the trading style, swing trader or day trader, a successful trader must possess some edge – it is of vital importance. Trading edges are necessary in the stock market, forex trading, futures markets, crypto, etc.
Trading results will evade you and success will always flow to other traders who possess the ability to identify an edge and manage risk.
What is an example of a trading edge?
An information trading edge can be knowing a company’s quarterly numbers before the public does or knowing merger and acquisition news ahead of the public. This is not legal activity but unfortunately has existed in the stock market since day one.
An example of price edge can simply be putting on a position at a price that has been historically cheap compared to other markets or to its own historical patterns. Trading edge based on price can often be quantified and is 100% legal. This is the most popular form of trading edge and what will be referred to in this post.
Trading Edge Formula
In short, edge is positive expectancy. What is and how do we calculate expectancy?
Expected value is the amount a trader should expect to gain if he were able to place infinite similar bets. EV, for short, is technically defined as the sum of all possible outcomes multiplied by the probability of each outcome’s occurrence. EV can be used as the most rudimentary form of trading edge.
EV = (Probability of Win * how much you win) – (probability of loss * how much you lose)
If EV is negative, we should not take the trade. We do not need a high win rate if the winning amount is large in comparison to what we could lose (think trend following).
There are two levers to move: win rate AND risk:reward. Too many traders get focused on one or the other. This graph is great to visualize how risk:reward and win rate relate.

All values based on $1 risk. 2.5 Reward indicates a profit of $2.5 and a loss of $1
Notice experienced traders can make more trading a 50% win rate strategy with 2:1 risk:reward compared to a trader who is accurate 70% of the time with a 1:1.
Now let’s dive into an example to make sure we fully understand expected value. Let’s discuss a coin-toss game where we have two scenarios:
- Heads happens 90% of the time and you win $1 each time.
- Tails happens 10% of the time and you lose $10 each time.
Would you play this game? Most beginner day traders salivate at 90%-win rates. However, the EV for this game is negative! The formula calculates 90% x $1 + 10% x -$10 = -$0.10. Edge needs positive expectancy.
This is a very important lesson that even with a 90%-win rate you can lose money! And trust me, you won’t win 90% of the time.
Do you need edge in trading?
Yes. If you do not have an edge, you are trading randomly, and no one can succeed randomly as trading has costs and randomness includes negative performance streaks. Most traders and trading strategies fail because they do not know or have an edge.
Most traders do not know or have an edge because they have never quantified their edge to see if it is truly an advantage over time, across symbols, and timeframes. New traders must understand this is necessary to becoming a profitable trader.
The first thing we need is an edge and a way to quantify that edge. Enter e-ratio or edge ratio.
What is Edge Ratio?
Edge Ratio is a quantified metric demonstrating how much favorable price movement occurs in comparison to how much adverse price movement occurs. Edge Ratio measures how much a trade goes in your favor compared to how much a trade goes against you. Edge Ratio or eratio quantifies trading edge.
I wrote extensively about e-ratio here: Edge Ratio in Automated Trading but will give a quick synopsis here.
We can plot eratio where the X-axis is the bars from the entry and the y-axis is how much more the trade is in your favor versus against you.
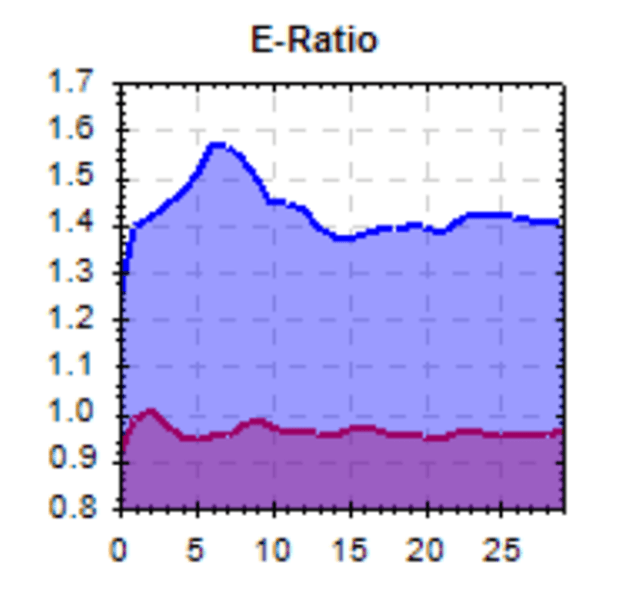
Blue edge ratio for trading signal. Red edge ratio for random trading signal for comparison
In the image above, we can clearly see that we have the most edge (blue line) six bars into this trade. The edge ratio is about 1.6 meaning we get about 0.6 more units of volatility in our favor than against us.
Trading any signal or entry that has an edge ratio below 1.0 is no better than a random entry determined by a monkey throwing darts.
I also spoke about edge ratio on the Better System Trader podcast.
- Full Episode: Better System Trader – David Bergstrom
- E-Ratio Clip: Better System Trader – Edge Ratio with David Bergstrom
How long might a trading edge last?
Can we know where to exit positions? Using edge ratio, or eratio, we can see when a trading edge begins to deteriorate. Knowing the edge ratio of an algorithmic trading strategy or any entry can help you determine the best exits and when your trade has overstayed its welcome.
In the above eratio image, you can see that after a hold time of six bars, the trading edge begins to deteriorate. In these cases, the best exit is around the six-bar mark as that is when the trading edge has shown most powerful.
More Winning Trades than Losing Trades does not mean Edge
Retail traders develop a trading strategy and wind-up optimizing parameters until the past performance shows more money than God. This trading approach often leads to overoptimized strategies that look great on historical data but have miserable live trading future results.
An individual trader should look for robust strategies that possess true edge and can survive various market conditions. A backtest that shows more winning trades than losing trades but has a negative or flat e-ratio is often an obvious sign of overfitting. Before you start trading new strategies live, always check the e-ratio to see there is actual edge to be captured and the backtest wasn’t pure luck.
Ways to Visualize Trading Edges
Edge Ratio is the best quantified measure of edge for algo traders, but there are a handful of other approaches to visualize your trading edge that are noteworthy.
Heatmap
we can view the forward returns from the entry where the x-axis shows bars since entry and each y-axis row is an individual trade. The color represents how profitable (green) the return was at each bar from entry. Analyzing two different signals on two different heat maps can clearly signal what was more profitable.

Equity Curve
the equity curve of an algorithmic trading system sums all trades to show the historical account value over time. We can think of the equity curve as the money earned (or lost) over time had a trader followed a specific rule or set of rules. Often strategy choices are obvious.

Distributions
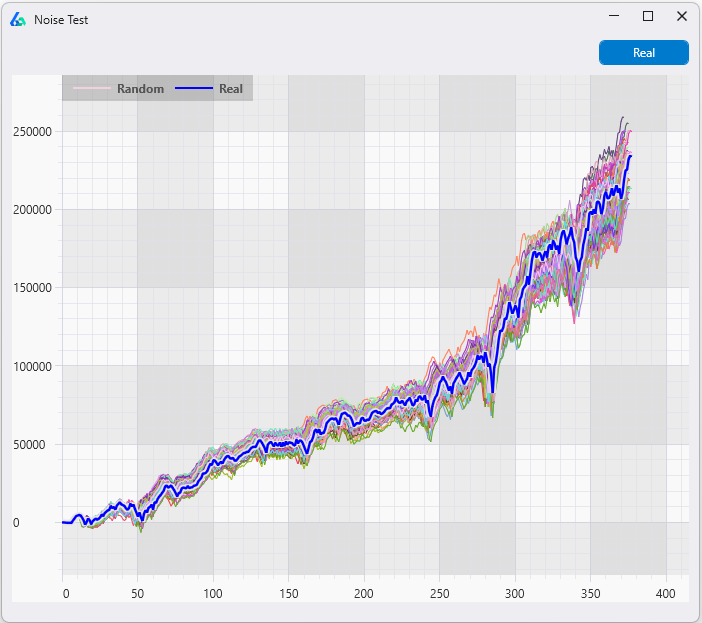
viewing all possible outcomes from a potential strategy can yield greater insights than just the heatmap or equity curve. We can run statistical tests like Monte Carlo Simulation and Analysis – more on this later – or other tests to generate a better sense of what is possible. We can think of this as how does my algo trading strategy do in alternate universes where the price data was similar but not exactly what my universe experienced.
Which P&L range would you prefer to be in after 50 trades? Some strategy paths are negative on the left where all are positive on the right. If markets change, trading systems like the one on the right can provide a buffer.

To read more about visualizing trading edges please check out my original post on See It Market here: What Does Trading Edge Look Like
Best Edge in Trading
Not every trade is a winner and there is no single best edge in trading. The best edge in trading is simply having one and executing it with discipline. We can quantify edge with edge ratio so that presents one way to rank our trading strategies. More capital should go toward stronger edges than weaker ones.
However, weaker edges can be combined via ensemble methods to potentially create stronger ones. I wrote about ensemble methods and strategies here: Ensemble Strategies – Build Alpha
Mental Edge in Trading for additional winning trades
Having a mental edge can also constitute a trading edge. The trading industry has convinced many traders that day trading and using a trading journal creates some mental edge. However, a mental edge should be thought of as additive and not a stand-alone edge!
For example, having a mental edge but no price edge cannot make for profitability. A mental edge in trading is the ability to remain disciplined and execute your price edge as planned (and as many times as possible).
With no price edge, having mental fortitude or mental discipline still means executing randomly but just in a calm fashion. Trading starts when we combine both mental edge and price edge.
Additionally, a mental edge can be aided with automation and algorithms. Utilizing automation is the simplest way to ensure your price edge is executed in a systematic fashion each and every time the edge reveals itself. To learn more about algorithmic trading please check out this full guide: Algorithmic Trading Guide.
Trading Edge, Winning Trades, and the Law of Large Numbers
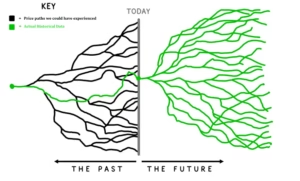
In the short-term, everything is random. In the long run, things tend to converge toward their expected value (which is our trading edge). This mathematical concept of convergence is known as the law of large numbers.

Many traders fail due to strategy hopping. That is, chasing the new shiny object, the next best strategy.
A terrible trader’s journey that most are on: find a strategy that does well for a while; however, when it starts to struggle either a) tweak it or b) learn some new strategy.
Either option changes the initial strategy aka strategy hopping. This tweaked or new strategy does well live trading for a while but ultimately arrives at another decision point between a) tweaking it again or b) finding a new shiny strategy.
Traders fail to give any strategy time to play itself out. This keeps them in short-term randomness!
The best illustration of short-term randomness and long-term expected value is to view a coin toss over time. Fair coins should land on heads 50% of the time. However, in small amounts of coin tosses we see large variations in the percentages. In only 30 tosses, we saw heads come up 73% of the time and in two other 30 coin toss trials we saw heads come up 43%.

However, after 100 coin tosses the percentages of heads converge toward the expected value of 50%. The law of large numbers is starting to work its magic!

After 10,000 coin tosses the percentages are almost always 50%. Assuming all things remain the same, the law of large numbers is inevitable.

Trading Example of the Law of Large Numbers
This algo strategy below has a remarkably smooth equity curve that most of us would love to see on our brokerage statements. This algo system averaged about $170 in profit per trade.

However, if we track this algorithmic trading strategy’s average trade over time, we can see that in the beginning, when our trust in the trading system is the lowest, it is a rather bumpy ride and far from the $170 per trade edge we wind up with. It takes well over 100 trades for the average trade to converge to the actual average!

Most traders cannot stomach this short-term “randomness” and wind-up abandoning ship to chase a new shiny object, indicator, or “holy grail” strategy.
Traders that fall prey to strategy hopping never let the edge play itself out and sadly never make it. If this is you – stay on the demo account! Trading decisions like this are often missed by other participants and take time to learn.
Some never escape this short-term randomness. My mentor explained this short-term randomness, long-term obviousness concept to me and a lightbulb clicked. Edge plus time is the name of the game.
Escaping Randomness was the perfect title of my Chat with Traders interview where I discuss how to overcome randomness and why algorithmic trading can help traders think about edge and risk-taking in a more productive way. If you haven’t already, please check out Aaron’s wonderful work here: Escaping Randomness with David Bergstrom.
Trading Edge Ideas and Trading Edge Examples
This blog post would be incomplete without mentioning some simple trading edges and where to begin your search to generate ideas for your own trading edges and limit your own risk.
Time of day trading
many stocks and commodities exhibit strong time of day patterns. For example, the S&P500 has been very strong for day traders from 2 AM ET to 3 AM ET for the last 15-plus years.

Buying one contract in e-mini S&P 500 at 2:00 AM ET and selling one hour later
Seasonality
many stocks show strong seasonal tendencies where repeatable patterns or price movement happens during the same calendar dates year after year.
Price Action
bar patterns and price comparisons can be a strong starting point to identify trading edges. However, always investigate and test thoroughly. Do not be misled by industry given names such as Bearish Engulfing. Read about trading “truths” here.
Relative Value
comparing one asset to another can provide an edge relative to another asset. This can assist non-directional traders, pair traders, and relative value traders with many trades in many markets.
Alternative Data
Using alternative data such as market breadth, economic data, interest rate spreads, Vix term structure, options flows, and more can provide additional areas to amplify or add trading edge to your portfolio.

some available alternative data signals in Build Alpha
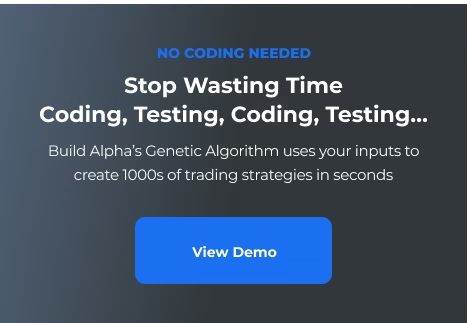
Using Build Alpha to enhance Trading Edge
Build Alpha allows you to require entry signals forcing the software to use these required signals on every strategy the genetic algorithm creates. The trader can also select thousands of other non-required signals to combine with any required signals. This process will then find the best complimentary signals for the required trading signals. This can take a known edge and enhance it without much effort or time.
Additionally, Build Alpha provides various ways to visualize trading edge for any strategy including e-ratio, monte carlo distributions, equity curves, and heat maps.
Finally, no edge is complete until it passes stress testing. Build Alpha offers the largest suite of robustness tests and checks for algorithmic trading strategies. Robustness testing is an edge of its own as many strategies fail in live markets.
Please check out the full suite here: Robust Trading Strategy Guide.
Need to Knows About Trading Edges
- Trading edge is necessary for trading success in any market
- Information edge is often illegal. Price edge is used by the best
- Expected Value and positive expectancy is often a great first step to quantify edge
- Edge Ratio is the best way to quantify edge and risk
- Let your market edge play out in time. Law of Large Numbers takes time to be profitable.
- Various types of trading edge exist including time of day, price action, alternative data
- Build Alpha algorithmic trading software can speed up the edge hunting process
Summary of Edge in Trading
Finding an edge in trading is often the difference between account growth and trading failure. There are two primary sources of edge in trading: information edge and price edge. Information edge consists of insider information or material non-public information. Price edge consists of data analysis and finding opportunities that others are unwilling to take.
The best traders quantify and rank their edges before deciding allocations. Edge Ratio is the best way to quantify and compare trading edges. In the end, finding one setup or trading edge is the key to long-term success in the markets. Creating a process or using software to quickly identify edges can be the difference between growth or trading randomly. Day traders be aware!
Author

David Bergstrom – the guy behind Build Alpha. I have spent a decade-plus in the professional trading world working as a market maker and quantitative strategy developer at a high frequency trading firm with a Chicago Mercantile Exchange (CME) seat, consulting for Hedge Funds, Commodity Trading Advisors (CTAs), Family Offices and Registered Investment Advisors (RIAs). I am a self-taught programmer utilizing C++, C# and python with a statistics background specializing in data science, machine learning and trading strategy development. I have been featured on Chatwithtraders.com, Bettersystemtrader.com, Desiretotrade.com, Quantocracy, Traderlife.com, Seeitmarket.com, Benzinga, TradeStation, NinjaTrader and more. Most of my experience has led me to a series of repeatable processes to find, create, test and implement algorithmic trading ideas in a robust manner. Build Alpha is the culmination of this process from start to finish. Please reach out to me directly at any time.