Monte Carlo Permutation Test
for Trading Strategies
The Timothy Masters method for separating skill from luck — and one of the strongest defenses against curve-fit backtests.
What’s Inside
- What Is Monte Carlo Permutation?
- How It Works (Step by Step)
- The Timothy Masters Origin
- Two Ways to Use MCP
- Use 1: Synthetic Data for Generation
- Use 2: Post-Simulation Filter
- MCP vs Other Monte Carlo
- MCP vs the Noise Test
- Automating MCP in Build Alpha
- Limitations & Pitfalls
- Is MCPT Enough?
- Takeaways
What Is a Monte Carlo Permutation Test?
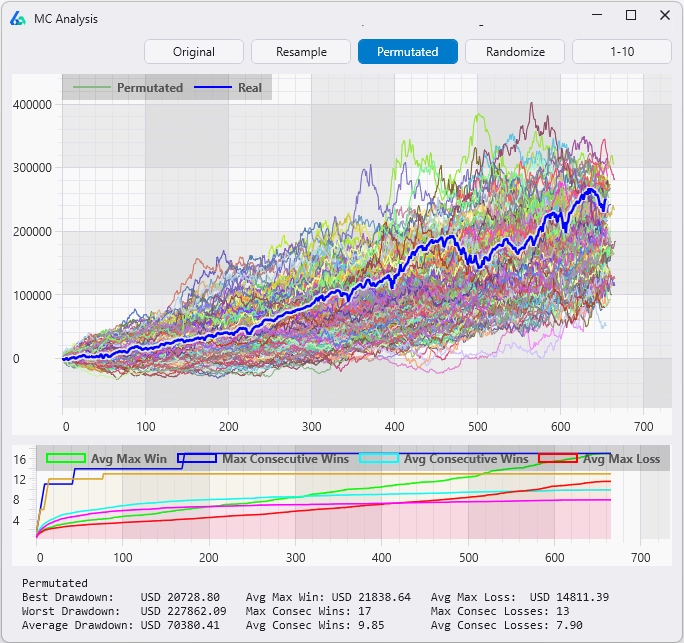
A Monte Carlo Permutation Test (MCPT) is a robustness test that shuffles the log returns of a historical price series to create many synthetic OHLC price paths — each with the same statistical properties as the original market, but with no real serial structure or repeating patterns.
A trading strategy is then re-run on thousands of permuted series. If the original backtest result outperforms the vast majority of permuted results, the strategy likely contains real edge. If the original is buried inside the distribution of permuted results, the backtest is most likely a lucky fit to historical noise.
In one sentence: MCPT answers the question “could my strategy have done this well on data with no real structural edge to find?”
Robustness Testing Hub — Deep Dives
How It Works (Step by Step)
The mechanics are surprisingly elegant. The goal is to produce a synthetic price series that has the same return distribution and volatility as the real market — but with all of the actual sequencing destroyed.
Because the same set of log returns is used, the synthetic series preserves the marginal return distribution, the volatility, the skew, and the kurtosis of the original market. What it does not preserve is the sequence — meaning trends, gaps, autocorrelations, regime cycles, and any repeating structural patterns are wiped out.
Quant Talk – Why Log Returns?
Log returns are additive across time, which makes the shuffle-and-rebuild step mathematically clean. Cumulative sums of log returns followed by exponentiation reconstruct a valid OHLC price series that begins at the same starting price and has identical compounding properties — without introducing arithmetic distortion.
The result is a market that looks plausible to any backtester — same volatility, same drawdown profile, same return characteristics — but with the specific ordering of events destroyed.
A strategy whose only edge comes from the specific sequence of historical bars will collapse on permuted data — there is no repeatable sequence left to exploit. But MCPT data is not patternless. It preserves the real market’s return distribution, volatility, and bar-level characteristics. What it removes is the specific order of events.
A strategy that still performs well on MCPT data has found something that does not depend on history unfolding in exactly the way it did.
The Timothy Masters Origin
Permutation testing as a statistical technique is decades old in academic statistics — but its application to trading systems was popularized by Dr. Timothy Masters, a statistician and author whose books are awesome reading for serious quantitative traders.
Masters laid out the framework in two key works:
- Permutation and Randomization Tests for Trading System Development
- Testing and Tuning Market Trading Systems
His central argument was simple and uncomfortable: most reported backtest results are statistically meaningless because traders never compute a baseline of what could have been achieved by chance on similar-looking data with no real edge. A 60% win rate sounds great until you discover that 80% of randomized versions of the same data also produced 60% win rates.
“Assessing our degree of confidence in our selection is an important and often neglected aspect of trading system development.” — Timothy Masters pg 130
Masters’ framework gives traders something they almost never have in this industry: a real p-value on a backtest result. If you run 1,000 permutations and your original strategy beats all but 10 of them, you have a p-value of 0.01 — meaning there is roughly a 1% chance the result is due to luck alone. That is a level of statistical rigor that so many lack before going live.
Why It Matters
Most robustness tests answer “would the strategy survive minor changes to the historical data?” The Monte Carlo Permutation Test answers a fundamentally different and stronger question: “would the strategy have looked this good on data that had no edge to begin with?”
Two Ways to Use Monte Carlo Permutation
There are two distinct workflows for MCPT, and both are valuable. They serve different purposes and can be used together in a complete research pipeline.
| Use Case | When | What It Tells You |
|---|---|---|
| Synthetic Data Generation | Before / during strategy build | Forces strategies to find structure that generalizes across many possible histories |
| Post-Simulation Filter | After backtest is complete | Computes a p-value on the result — is this skill or luck? |
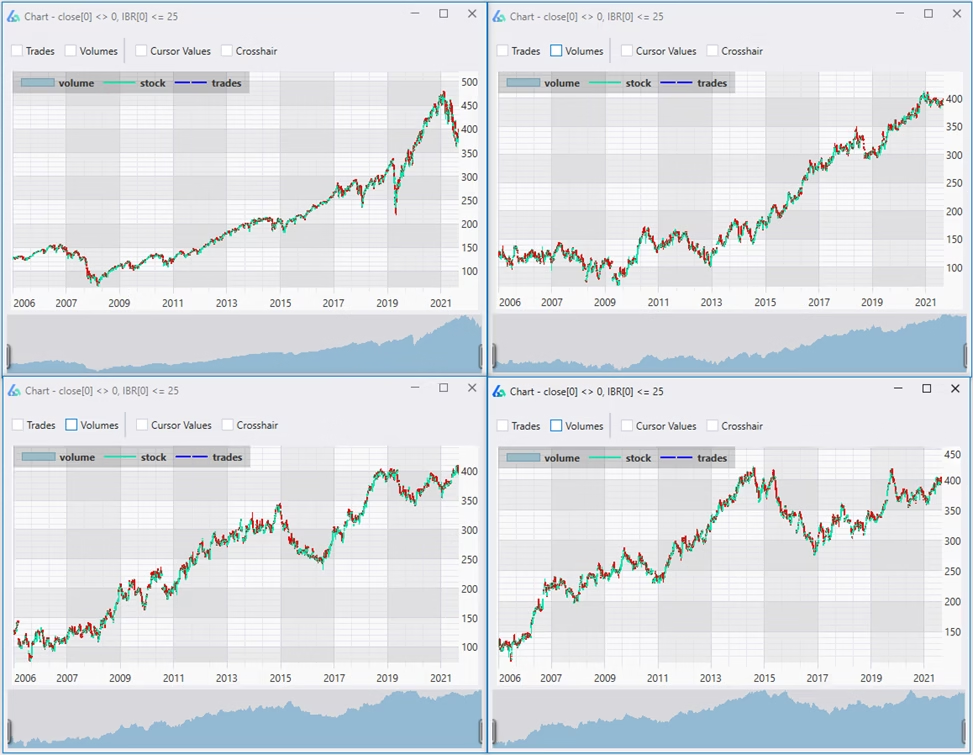
Use 1: Permuted Series as Synthetic Data for Strategy Generation
The first application — and the one most traders overlook — is using permuted price series as training data for strategy generation.
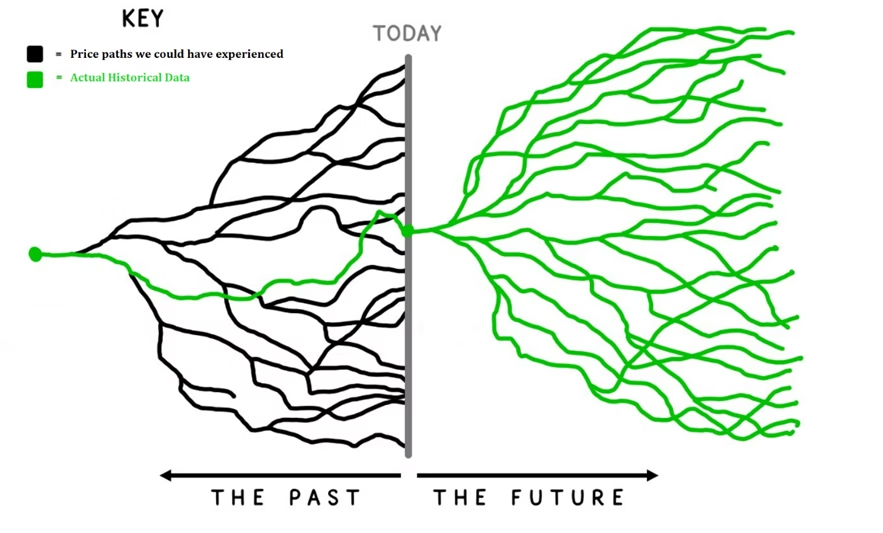
Standard strategy generation searches for patterns in one historical price path. The problem is obvious: there is only one S&P 500 history, only one EUR/USD history, only one Crude Oil history. Any strategy that looks good on that single path may simply have memorized its specific noise.
By generating strategies on a collection of permuted series — each one a plausible alternative version of the same market — you force the search to find structure that generalizes. Strategies that only worked because of one specific sequence of bars are eliminated automatically because they fail on the alternative paths.
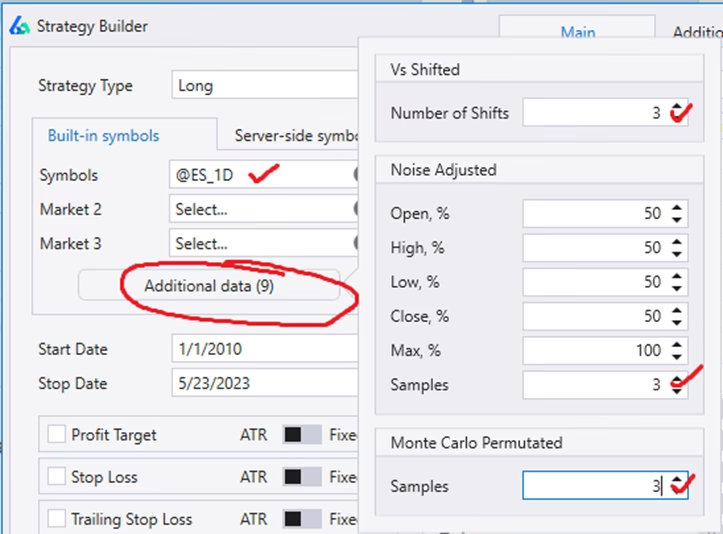
Build Alpha includes this directly through its Additional Data feature in the strategy generation workflow. Users can add synthetic data series alongside the real historical data, choosing from three options:
- Noise — original price sequence with added or subtracted volatility
- Vs Shifted — historical data shifted in time to break exact bar alignment
- MCPT — Monte Carlo Permutation series (the Masters method) with the sequence fully shuffled
How Build Alpha Searches Across MCPT Variations
When MCPT is added as Additional Data pre-simulation, Build Alpha evaluates every candidate parameter set across the real series and the permuted variations simultaneously.
The fitness function averages performance across all variations, so a parameter set that only worked because of one specific sequence of bars gets penalized — it cannot ride a single lucky history to the top of the rankings. The search rewards parameters that perform well across many plausible alternate versions of the same market.
Search On One Path → vs → Search Across Many Paths
The standard workflow generates strategies on one historical sequence and then runs robustness tests on the survivors. Build Alpha’s pre-simulation MCPT workflow flips this: robustness is built into the search itself. The strategies that emerge have already proven they generalize across many possible histories before you ever see them.
Isn’t Training on MCPT Data Self-Defeating?
A fair question: if MCPT data is designed to have no repeating serial patterns, why train strategies on it?
The answer is that MCPT data is not patternless — it preserves the real market’s return distribution, volatility, and bar-level characteristics. What it removes is the specific sequence of those returns.
Training across MCPT variations doesn’t reward finding structure in noise. It rewards finding parameter sets that don’t depend on the real market’s history unfolding in one exact way. A moving average length that works on 50 shuffled versions of S&P history is a better-justified choice than one that only looked best on the single actual history — even though both strategies use the same logic.
The conceptual frame is worth stating directly: most traders aim to answer the question “which parameters worked best on the one history we have?” Build Alpha’s pre-simulation MCPT workflow answers a stronger one — “which parameters worked well across many histories the market could plausibly have produced?” A parameter set that survives this kind of search has cleared a meaningfully higher bar than one that only had to look good on a single path.
For the full breakdown of synthetic data approaches and when to use each one, see Synthetic Data for Trading Strategies.
Use 2: Post-Simulation Robustness Filter (Masters’ Original Use)
The second application is the one Masters originally championed: applying MCPT after a strategy has been built and backtested, as a final statistical sanity check.
The workflow looks like this:
If your real backtest produced a profit factor of 1.85 and only 12 out of 1,000 permuted versions achieved 1.85 or better, your p-value is 0.012. There is roughly a 1.2% chance the result is due to luck. That is a strategy worth exploring further.
If 470 out of 1,000 permuted versions matched or beat the real result, your p-value is 0.47 — essentially a coin flip. That is a strategy that should be discarded immediately, no matter how pretty the equity curve looks.
⚠️ The Hard Truth
A large percentage of “good-looking” backtests fail the Monte Carlo Permutation Test. This is uncomfortable, but it is exactly why the test exists. Better to discover a strategy is luck on synthetic data than on a live trading account.
✓ Belt And Suspenders
The two uses are complementary, not redundant. Strategies that were trained against MCPT variations as Additional Data and then pass the post-simulation MCPT test have cleared the bar twice — once during parameter selection, once after as a Masters-style p-value check. Same underlying technique applied at two different stages of the research pipeline.
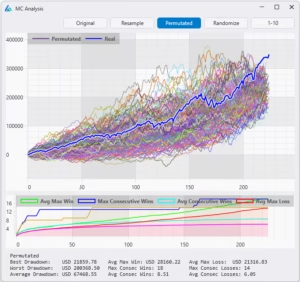
MCPT vs Other Monte Carlo Methods
The word “Monte Carlo” gets used loosely in trading. It is worth being precise about what each variant actually tests.
| Method | What It Shuffles | What It Tests |
|---|---|---|
| Reshuffle | Order of historical trades | Alternate drawdown paths to the same total P&L |
| Resample | Trades drawn with replacement | Wider distribution of possible outcomes |
| Randomized | Exit logic, keeping entries | Whether your edge lives in entries or exits |
| Permutation (MCPT) | Bar-by-bar log returns of price | Whether the strategy itself contains edge |
The first three operate on the trade list after a backtest is complete. They are useful for understanding the distribution of possible outcomes given the trades that were realized — but they cannot tell you whether the strategy logic itself contains real edge, because they never re-run the strategy.
The Monte Carlo Permutation Test is fundamentally different. It re-runs the entire strategy on each new synthetic series, evaluating every entry and every exit on data the strategy has never seen. This makes it the only Monte Carlo variant that truly tests the strategy’s discovered patterns rather than its realized outcomes.
For the complete walkthrough of all four Monte Carlo variants with a free simulator and side-by-side examples, see the Monte Carlo Simulation Complete Guide.
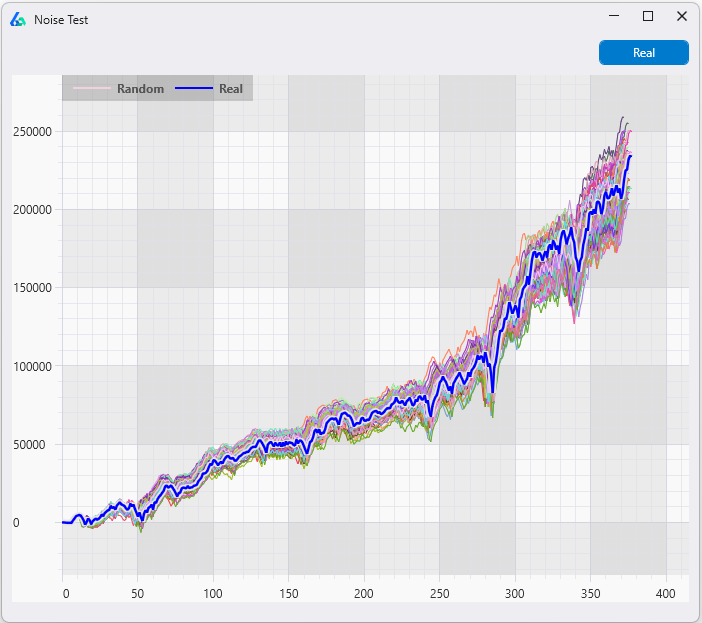
MCPT vs the Noise Test: Two Different Questions
Of all the robustness tests in the toolkit, the Noise Test is MCPT’s closest cousin — both perturb the price data itself rather than the trade list. But they answer fundamentally different questions, and understanding the distinction is one of the most important things a strategy developer can internalize.
The simplest way to think about it: the Noise Test preserves the historical sequence and perturbs the prices. MCPT preserves the return distribution and shuffles the sequence. Or, asked as two questions: “What if prices had been slightly different along the same path?” versus “What if the same returns had occurred with different paths?”
| Dimension | Noise Test | Monte Carlo Permutation |
|---|---|---|
| What’s preserved | The historical sequence and path | The marginal return distribution |
| What’s perturbed | Exact bar-by-bar prices (small jitter) | The order of returns (full shuffle) |
| Trends & regimes | Still present | Wiped out |
| Volatility clustering | Still present | Wiped out |
| Question it answers | Is the strategy fragile to small price changes? | Does the strategy’s edge depend on real serial structure? |
| What it catches | Strategies fit to noise within the structure | Strategies whose “edge” survives even when sequence is destroyed |
What the Noise Test Tests For
The Noise Test adds or subtracts small amounts of volatility to every bar of the original price series. The shape of the market is preserved — trends still trend, crashes still crash — but the exact prices are nudged slightly.
This catches strategies that depend on exact historical prices. If your strategy fires at 4,237.50 but not at 4,237.25, it is fit to noise inside the historical structure, and the perturbed series will expose it.
Critically, the Noise Test still runs on essentially the same market. Trends, regimes, and autocorrelations are all preserved. A strategy that genuinely exploits market structure will survive the Noise Test — and that’s the point.
What MCPT Tests For
MCPT goes one level deeper. Instead of noise-adjusting prices within the historical structure, it destroys the structure entirely by shuffling log returns into a new random sequence. The synthetic series keeps the same return distribution and volatility — but trends, regimes, and autocorrelation are all rearranged.
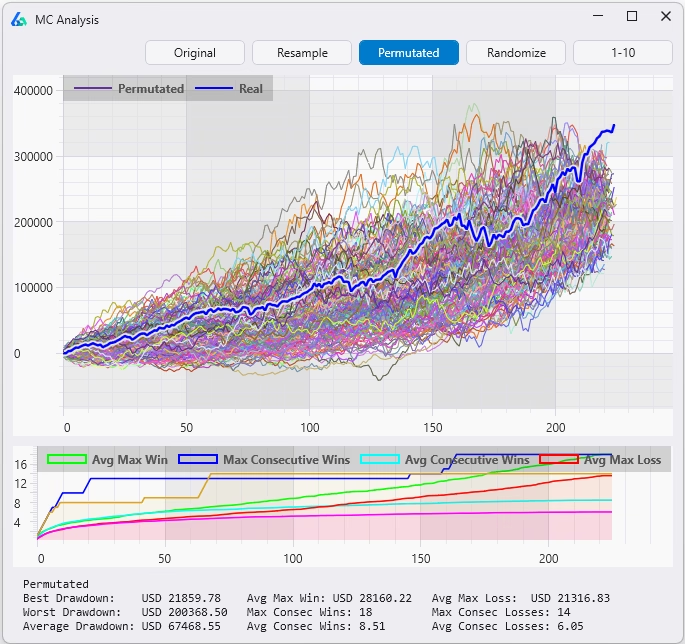
The test then asks a precise statistical question: does the original backtest beat the distribution of permuted backtests? If the strategy was genuinely exploiting real serial structure, the permuted runs will produce noticeably weaker results and the original will sit above them. That gap, expressed as a p-value, is the evidence of a real edge.
The failure mode is the opposite: a backtest buried in the middle of the permuted distribution. The strategy performs about as well on shuffled data as on the real market — meaning whatever it “discovered” was not dependent on the actual sequence of bars at all. Usually this happens because the strategy is implicitly capturing properties of the return distribution itself — drift, volatility, skew — rather than a repeatable pattern in how those returns are ordered.
Such a strategy may still be profitable live, because those distributional properties are real. But it has not discovered structure. It has discovered exposure. And if exposure is the edge, you could likely capture it with something far simpler. MCPT’s job is to tell you which kind of edge you actually have.
The Layered Defense
The two tests are complementary, not competing. The Noise Test asks: “Did my strategy memorize exact prices?” MCPT asks: “Did my strategy memorize the exact sequence of history?” A robust strategy needs to pass both — fit to neither the noise within the structure nor the structure itself.
A Concrete Example
Imagine two strategies that both look profitable in backtest:
- Strategy A — 20-day breakout trend-follower. Edge comes from real serial structure: strong moves tend to continue. On the original series it produces strong results. On 1,000 permuted series — where there are no genuine trends to ride — it produces noticeably weaker results. The original sits in the top 2% of the distribution. p-value = 0.02 → passes MCPT.
- Strategy B — Heavily over-optimized with many parameters. Its flexible rules can find spurious “patterns” in almost any data. On the original series it produces a great-looking equity curve. On 1,000 permuted series it produces about the same results, because it fits random data nearly as well as real data. The original sits right in the middle of the distribution. p-value = 0.48 → fails MCPT.
Strategy A performs worse on permuted data — and that gap is exactly why it passes. Strategy B performs about the same, proving whatever it found did not depend on the actual market sequence. A backtest that does not need real structure to look good is a backtest that should not be trusted with real money.
⚠️ Which Should You Run First?
Run the Noise Test first — it’s faster and cheaper, and it eliminates the most obvious fragility. Then run MCPT on the survivors. The strategies that pass both have demonstrated robustness to two completely different perturbation philosophies, which is the strongest single signal you can get from price-data robustness testing.
Automating Monte Carlo Permutation in Build Alpha
Running 1,000+ permutations — for one strategy — is a project. Running it for hundreds of strategy candidates is impossible without automation and performance computing. This is exactly the gap Build Alpha fills.
In Build Alpha, the Monte Carlo Permutation Test is a built-in robustness filter that runs automatically as part of the strategy generation workflow. You define the threshold once — for example, “the strategy must beat 90% of permuted results” — and only strategies that clear that bar show in the results window.
What the Automated Workflow Looks Like
- Define your strategy generation parameters — markets, signals, fitness, in-sample window.
- Enable Monte Carlo Permutation as a filter — set your survival threshold.
- Stack additional filters — Noise Test, Vs Random, Walk-Forward, out-of-sample consistency.
- Run the generation — Build Alpha generates and tests thousands of candidates in parallel.
- Review only the survivors — every strategy you see passes your robustness gauntlet.
✓ The Result
Instead of staring at hundreds of pretty equity curves and trying to guess which ones are real, you review a small handful of strategies that have already proven their results are statistically unlikely to be luck. The results window only shows MCPT survivors. A total time saver.
This is the exact workflow described in the broader Robustness Testing Guide — MCPT is one of the strongest filters in that pipeline because it tests the strategy logic itself, not just its realized trades.
Limitations & Pitfalls
No single test is bulletproof. A few things to keep in mind when interpreting MCP results:
- Permutation destroys serial correlation. If your strategy is specifically designed to exploit autocorrelation or trend persistence, the permuted series will not contain those structures. This is the point of the test, but it means a passing MCP result is particularly meaningful for trend and momentum strategies.
- The marginal distribution is preserved. Strategies that exploit fat tails or volatility clustering may still see some signal in the permuted data. The test is strongest against strategies that exploit specific sequence patterns.
Is MCPT Enough?
MCPT is a great skill-vs-luck filter and an even better sequence-dependent test. However, it should not be treated as definitive proof.
If a strategy beats all MCPT runs, the right conclusion is more like “this result is unlikely to be explained purely by the return distribution with sequence removed” not “this strategy is definitely robust”.
It’s a positive sign. Not final proof. Stack it with the Noise Test and Vs Random benchmarking and you cut down the hundreds and thousands of pretty equity curves trying to fool you. Here’s a quick video on those two tests.
Takeaways
✓ Key Takeaways
- MCPT shuffles log returns to create synthetic price paths with no real edge
- Re-running the strategy on each gives a real p-value on the backtest
- Use it as synthetic training data and as a post-simulation filter
- It is the only Monte Carlo variant that retests the strategy logic itself
- Combine with other robustness tests for the strongest defense against curve fitting
💡 Need to Know
- Timothy Masters formalized this technique for trading system developers
- 1,000 permutations is the standard minimum for a meaningful p-value
- Build Alpha automates MCPT as a built-in strategy generation filter
- Strategies that pass MCPT are statistically unlikely to be luck
- A failing MCPT result means the strategy’s edge does not depend on real serial structure
Summary
The Monte Carlo Permutation Test is one of the most rigorous robustness checks available to systematic traders — and one of the least used. MCPT asks the only question that actually matters: could this result have been produced by luck alone on data with no real edge?
Used as synthetic data during strategy generation, permuted series force your search to find structure that generalizes across many possible histories. Used as a post-simulation filter, MCPT gives you a real p-value on the backtest — the kind of statistical rigor that almost no trading software provides.
Build Alpha includes both workflows out of the box. You can generate strategies on permuted price series, apply MCPT as an automated filter on every candidate, and only ever look at the strategies that survive. Break your strategies on synthetic data — before the market breaks them on live data.

David Bergstrom
A decade-plus in professional trading as a market maker and quantitative strategy developer at a high-frequency trading firm with a CME seat. Consulting for hedge funds, CTAs, family offices, and RIAs. Self-taught C++, C#, and Python programmer specializing in data science, machine learning, and trading strategy development.
Frequently Asked Questions
What is the Monte Carlo Permutation Test in trading?
The Monte Carlo Permutation Test (MCPT) is a robustness test that shuffles the log returns of a historical price series to generate thousands of synthetic price paths, then re-runs your strategy on each one to see whether the original backtest result is statistically distinguishable from luck. If the real backtest outperforms nearly all permuted runs, the strategy likely contains real edge. If it sits in the middle of the distribution, the result is almost certainly a curve fit to historical noise.
How does MCPT actually generate synthetic price data?
MCPT converts historical OHLC prices into log returns, randomly shuffles the order of those returns, and then rebuilds a new price series by taking the cumulative sum and exponentiating. The resulting synthetic market preserves the original return distribution, volatility, skew, and kurtosis — but destroys trends, regimes, gaps, and autocorrelation.
Why are log returns used instead of raw price changes?
Log returns are additive across time, which makes shuffling and reconstructing the series mathematically clean. Cumulative sums of log returns followed by exponentiation rebuild a valid OHLC series that starts at the same price and has identical compounding properties, with no arithmetic distortion introduced by the permutation step.
What is a good p-value for MCPT in strategy development?
A p-value below 0.05 is the common minimum threshold, meaning the original backtest beat at least 95% of permuted runs. Stricter developers require 0.01 or better. A p-value above roughly 0.10 is a red flag — it indicates the strategy performs about as well on shuffled data as on real data, which means its edge does not depend on real serial structure.
How many permutations should I run for MCPT?
1,000 permutations is the standard minimum for a meaningful p-value and matches Timothy Masters’ original recommendation. Running fewer than a few hundred leaves the p-value too coarse to trust, while running 5,000 or 10,000 sharpens the estimate for borderline cases. Build Alpha automates this so you can batch-test hundreds of strategy candidates against 1,000+ permutations each without manual scripting.
What is the difference between MCPT and a standard Monte Carlo simulation?
Standard Monte Carlo methods (reshuffle, resample, randomized exits) operate on the trade list after the backtest is complete and only show alternate distributions of the trades you already got. MCPT operates on the price series before the backtest — it rebuilds the market itself and re-runs the entire strategy from scratch on each synthetic path. This makes MCPT the only Monte Carlo variant that tests the strategy’s discovered patterns rather than its realized outcomes.
MCPT vs Noise Test — which one should I use?
Use both. The Noise Test preserves the historical sequence and perturbs the prices, catching strategies fit to exact bar values. MCPT preserves the return distribution and shuffles the sequence, catching strategies whose edge survives even when real structure is destroyed. Run the Noise Test first because it is faster and eliminates obvious fragility, then run MCPT on the survivors for the deeper sequence-dependence check.
Can I train strategies directly on MCPT data?
Yes — and it is one of the most underused techniques in systematic trading. Build Alpha lets you add MCPT series as Additional Data during strategy generation, so every candidate parameter set is evaluated across the real series and many permuted alternatives at once. Parameters that only worked because of one specific historical sequence get penalized automatically, and the strategies that survive have proven they generalize across many plausible histories.
Isn’t training on permuted data just fitting to noise?
No — MCPT data is not patternless. It preserves the real market’s return distribution, volatility, and bar-level characteristics; only the specific sequence of events is removed. Training across MCPT variations rewards parameter sets that perform well regardless of which exact history the market produced, which is a stronger robustness bar than optimizing on a single path.
Who invented the Monte Carlo Permutation Test for trading?
Permutation testing as a statistical technique is decades old in academic statistics. Its application to trading system development was formalized and popularized by Dr. Timothy Masters in his books Permutation and Randomization Tests for Trading System Development and Testing and Tuning Market Trading Systems. Masters’ central argument is that most reported backtest results are statistically meaningless without a permutation baseline to compare against.
What does it mean if my strategy fails MCPT?
A failing MCPT result — where the original backtest sits inside the distribution of permuted runs — means the strategy performed about as well on shuffled data as on real data. Its edge does not depend on the actual sequence of market history, which usually indicates the strategy is implicitly capturing distributional properties like drift or volatility rather than a repeatable pattern. It may still be profitable live as exposure, but you have not discovered structure.
Does passing MCPT guarantee my strategy will work live?
No. MCPT is one of the strongest skill-vs-luck filters available, but it tests sequence-dependence only — it does not protect against regime change, execution costs, or data-snooping across many strategies. Treat a passing MCPT result as strong evidence the backtest is not pure luck, and combine it with the Noise Test, Vs Random benchmarking, and walk-forward optimization for a complete robustness stack.
How does Build Alpha automate MCPT?
Build Alpha runs MCPT as a built-in filter inside the strategy generation workflow. You set a survival threshold once — for example, must beat 90% of permuted results — and only strategies that clear that bar appear in the results window. The platform handles generating the permutations, re-running the strategy on each, computing the p-value, and doing it in parallel across thousands of candidate strategies.
Is MCPT better than walk-forward optimization?
They test different things and should be used together. Walk-forward optimization tests whether parameters chosen on in-sample data hold up on out-of-sample data drawn from the same market history. MCPT tests whether the strategy’s edge depends on real serial structure at all, across many alternative histories. A strategy that passes both has cleared two independent bars: it generalizes forward in time and across plausible alternative pasts.
Can MCPT be used on any market or timeframe?
Yes. Because MCPT operates on log returns, it works on any OHLC series — equities, futures, FX, crypto, or any timeframe from tick to monthly. The only practical constraint is having enough bars to produce meaningful permutations; very short series limit how much structure the shuffle can plausibly destroy and rebuild. For most systematic strategies, a few thousand bars is more than sufficient.
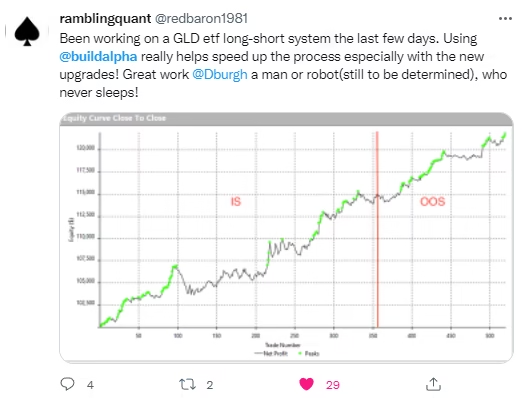
What Traders Say About Build Alpha


Explore More
Beat the Permutations.
Beat the Market.
Automated Monte Carlo Permutation. 1,000 trials per strategy. Built into every backtest.