The hardest part of strategy development is not building a backtest that looks good on historical data. The hardest part is knowing whether that backtest has real edge…or whether it’s simply the best-looking result from a lot of random tests.
That’s where the Vs. Random test comes in.
This concept is widely associated with Jaffray Woodriff (QIM / Quantitative Investment Management) and was popularized for many traders (myself included) through his chapter in Hedge Fund Market Wizards. The idea is simple and brutally honest:
→ Build the best strategies you can using random data and random signals.
→ Use the best “random strategy” as the baseline.
→ If your strategy can’t beat the best random strategy, there’s unlikely a real edge.
This post explains what the Vs. Random test is, how to run it, and how to interpret the results. Perhaps some other insights from my days jamming on machine learning models and validation techniques.
What is the Vs. Random Test?
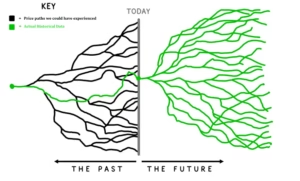
The Vs. Random test is a robustness check that answers the question: “Could I have achieved similar results by luck?”
Instead of comparing your strategy to “buy & hold” or to a benchmark index, you compare it to a more uncomfortable opponent: the best strategy produced by randomness under similar constraints.
That is, we mine the data for random strategies with random signals and find the best one to compare our real strategy against.
If our strategy can’t exceed this baseline in a meaningful way, there’s a strong chance the strategy is:
- overfit to historical noise
- exploiting data quirks
- or simply a statistical fluke
This is why Vs. Random is best thought of as an anti-self-deception tool; it can help identify lying backtests and overfit results before we risk real capital. We want robust trading strategies, not lucky ones.
Why a Random baseline is so powerful in Machine Learning
If you generate enough strategies, you will eventually find a “winner” even if there is no real signal.
This is just statistics:
- With enough trials, some outcomes will look exceptional by chance.
- Optimization amplifies this effect because it selects the best outcome from a large pile.
So, a strategy that looks great in a backtest may not be “good.” It may just be the best survivor of randomness or many trials. A random baseline test creates a controlled way to ask: “Is my strategy genuinely better than what randomness can produce?”
How the Vs. Random Test works (high level)
There are a few common implementations, but they generally fall into these buckets:
1. Random signals on real price data
- Keep the real market data.
- Replace your “signals” with random entries/exits (or random rule triggers).
- Optimize those random rules the same way you optimize real rules.
If the best random strategy looks similar to your “real” strategy…that’s a problem.
2. Real signals on randomized/synthetic data
- Keep your signal logic (or your rules).
- Randomize or add random noise to the underlying price series in a way that breaks structure (while preserving some statistical properties).
- Re-run/optimize.
If the strategy performs similarly on new data with destroyed structure, you may be fitting noise.
3. Random signals on randomized data (pure random baseline)
- Randomize both.
- Use the best result as an “upper bound” of what luck can generate.
This becomes a harsh benchmark, but it’s useful when you’re trying to avoid lying backtests in large strategy searches.
Why Three Different Randomization Methods?
Trading is a game of removing as much risk as possible. The random generation process is also a risk factor that can introduce biases. Using multiple random generators, randomizing signals, data and both signals and data provides us with a more robust way of generating the harshest benchmark we possibly can.
Risk management isn’t just for executing trades but also for your development process!
What should you compare against the random baseline?
At minimum, compare:
- Net profit / CAGR
- Max drawdown
- Sharpe / Sortino
- Profit factor
- Consistency metrics (win rate, average trade, distribution shape)
- Equity curve shape
- Trade count
But the key is: don’t just compare any metric of past performance. We really don’t care about any single metric. We care about the metric that we optimized for. If you optimize for Sharpe ratio then compare against the best Sharpe ratio the random process generated.
How to Interpret Trading Strategy Vs. Random results
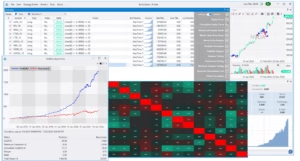
Most of analysis using Vs. Random test to avoid overfitting can be eyeballed – crazy talk from a quant, right? But generally speaking, we really only care if our strategy is better than the random baseline which we can tell quite easily on a chart.
PASS (good sign)
Your strategy is clearly better than the best random strategy. No need to compare risk-adjusted returns, drawdown profiles, equity curve shape, etc. Just simply look at the equity curve (blue) vs. the random distribution (red) and make a judgement call.
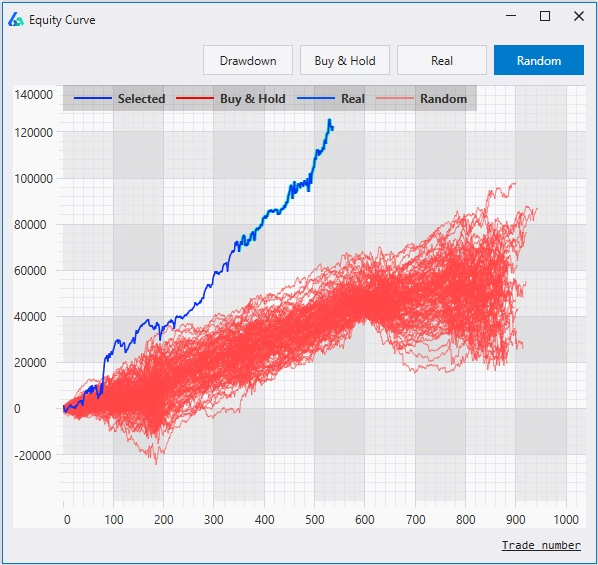
This doesn’t guarantee success, but it increases confidence the strategy’s edge is not easily explained by luck.
BORDERLINE
Your strategy is only slightly better than random, or better on profit but not on risk.
This usually means one of:
- strategy is weak and needs improvement,
- your search constraints are too broad (allowing random strategies to “win”),
- you’re over-optimizing
- or the market/timeframe is extremely noisy (harder to prove edge).
FAIL (important warning)
Your “real” strategy does not beat the best random strategy (or only beats it on cherry-picked metrics).
This often indicates:
- curve fitting / over-optimization,
- parameter fragility,
- or a strategy that doesn’t generalize.
It’s better to learn this in research than with real capital. Avoid these strategies like the plague. A lack of understanding here is often what leads to a lot of hate for data mining and automatic strategy generation.
Common mistakes when running Vs. Random Test to avoid overfitting
Mistake 1: Comparing to “average random”
We don’t care about the average random strategy. We care about the best random strategy, because your strategy search is also selecting the “best”. The correct comparison is: best vs. best.
Mistake 2: Not matching constraints
If your real strategy search allows certain leverage, hold times, or exits, then the random search must use the same constraints. Otherwise, you’re not comparing like-to-like. If one strategy generation process can use X or filter some condition, then the random generation process should use X or filter the same condition.
Mistake 3: Not matching fitness
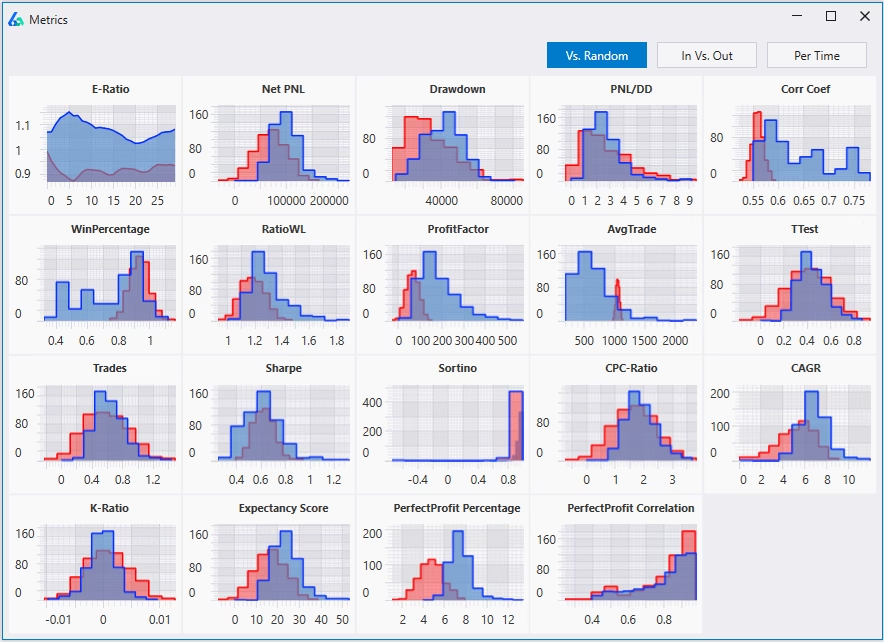
Building a strategy that aims to optimize for Sharpe ratio or Profit Factor then comparing its P&L to the Vs Random distribution is missing the mark. The backtest should be compared against the Vs Random test trading strategies’ same metric. That’s why Build Alpha allows this view so you can view the real strategies distribution vs the random strategies distribution for all performance metrics.
Mistake 4: Ignoring sample size
A strategy that “beats random” over a tiny number of trades isn’t convincing. Edge materializes over many trials. Finding a strategy that beats random on a small number of trades can still be luck.
Think of a coin toss with only ten flips. If you get seven heads does that mean this coin is 70% likely to land on heads? But a coin with dozens or hundreds of flips showing 70% heads? Or 7,000 heads on 1,0000 flips is very easily considered a rigged coin.
Mistake 5: Treating a pass as proof
A pass does not mean “guaranteed profitable.” Nothing does. A pass means “less likely to be pure luck.” There’s too much bad content out there stating otherwise.
You still need:
- out-of-sample testing
- Monte Carlo simulations
- Noise Testing
- and sanity checks around slippage/commissions.
(Full list here: https://www.buildalpha.com/robustness-testing-guide/)
Where Vs. Random fits in a robustness workflow
A simple order that works well for many traders:
Core sanity checks (cost assumptions, minimum trades, avoid overly precise parameters)
- Out-of-sample validation
- Monte Carlo (streaks + drawdown expectation)
- Noise Test (detect fitting to noise)
- Vs. Random baseline (prove edge vs luck)
- Across markets
- Walk-forward (optional but strong)
Automated Workflows in Build Alpha
Build Alpha v3 now supports Automated Workflows. You can set this test as a filter prior to starting strategy generation and Build Alpha will only return strategies that pass this test. This is an enormous time saver vs. checking this test manually for every candidate strategy.
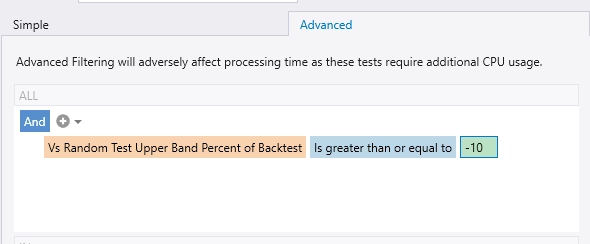
The above setting would force Build Alpha to reject any strategy that is not at least 10% better than the best Vs Random result. In short, the best Vs Random is more than 10% below the backtest.
Related Build Alpha reads:
- Robustness guide: https://www.buildalpha.com/robustness-testing-guide/
- Monte Carlo: https://www.buildalpha.com/monte-carlo-simulation/
- Noise Test: https://www.buildalpha.com/noise-test/
Practical takeaway
If you generate enough strategies, you can “discover” profitability by accident. The Vs. Random test gives you a reality check:
- If you can’t beat the best random baseline, stop trusting the backtest.
- If you can beat it meaningfully, you’ve cleared a higher bar than most traders ever apply.
That’s how you reduce the odds of trading a “lucky” strategy disguised as skill.
FAQ
No. Monte Carlo typically tests uncertainty in trade sequence / sampling. Vs. Random tests whether your performance can be explained by luck and selection bias.
It’s a strong sign, but not proof. You still need OOS, costs, and robustness checks. And an obvious reminder there are no guarantees of future results in live trading – we simply aim to shift the odds.
Yes—especially when you generate/optimize many of them. That’s the entire point. The wrong approach is to dismiss technology because a computer can build random strategies well. The right approach is to use these as a benchmark to validate.
In general, it does slightly. If you wish to disable this test and improve processing time, then simply turn it off in the Additional Settings (pictured below).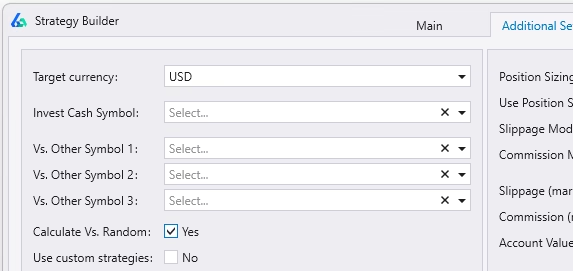
Summary
Build Alpha’s Vs. Random test helps you explore whether a backtest is real edge or just noise. The idea is to develop the best strategies possible using random signals and random data, then use the best random result as a baseline based on the same rules, constraints, and asset.
If your “real” strategy can’t beat the best random baseline, it’s often sensitive to small variations and may be fitting history rather than capturing something durable through the market cycle. Sensitive strategies don’t work. Don’t save these strategies. They won’t end well.
“Lucky” backtests can deliver false confidence—and then real trading can bring unexpected losses when conditions change. In Build Alpha you can save the results to a file on your device, compare against the random benchmark, and focus only on strategies that prove they can outperform the best random outcome before risking capital with actual money. Build Alpha can test automatically these things and only deliver strategies that pass robustness tests based on your pre-set filters.
As always: thanks for reading,
Only essential cookies used. No downloadable files, word documents or offered services.