// THE UNCOMFORTABLE TRUTH
Your Backtest
Is Lying to You.
Every platform shows you a pretty equity curve. Only one tells you if it’s real.
What Most Traders Do
- Find a strategy that “works” in backtest
- Get excited by the equity curve
- Go live immediately
- Watch it fail within weeks
- Blame the market, repeat
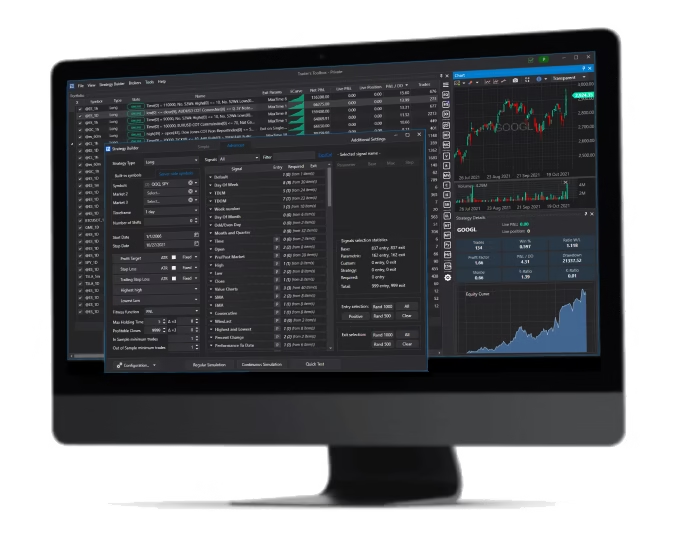
What Build Alpha Does
- Generate strategies from 7,000+ signals
- Stress-test with 12+ robustness tests
- Kill curve-fit strategies automatically
- Export code to your broker, one click
- Trade with confidence, not hope
Two Strategies, One Truth
Only One Survives Forward Testing
Both look great in backtest. Only robustness testing reveals which is real.
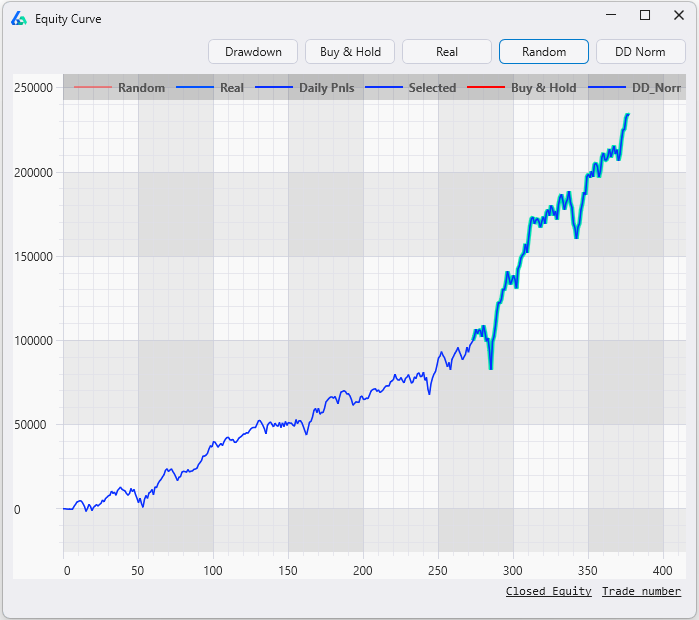
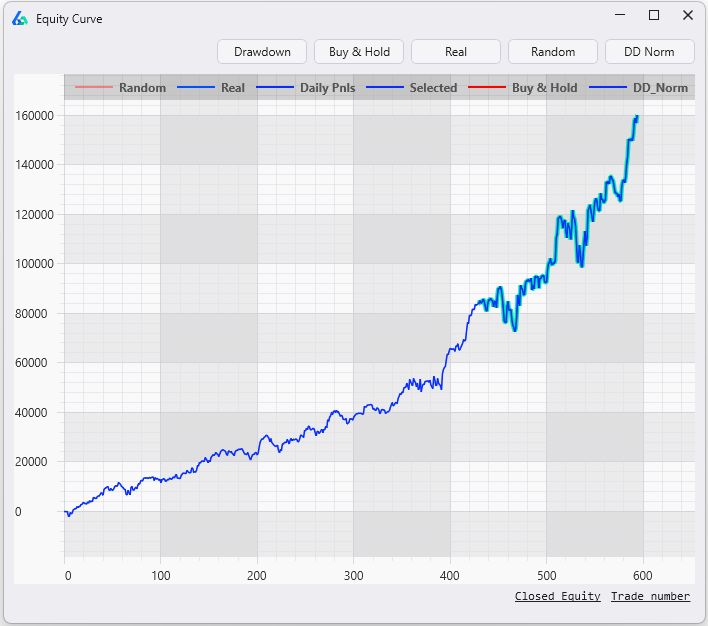
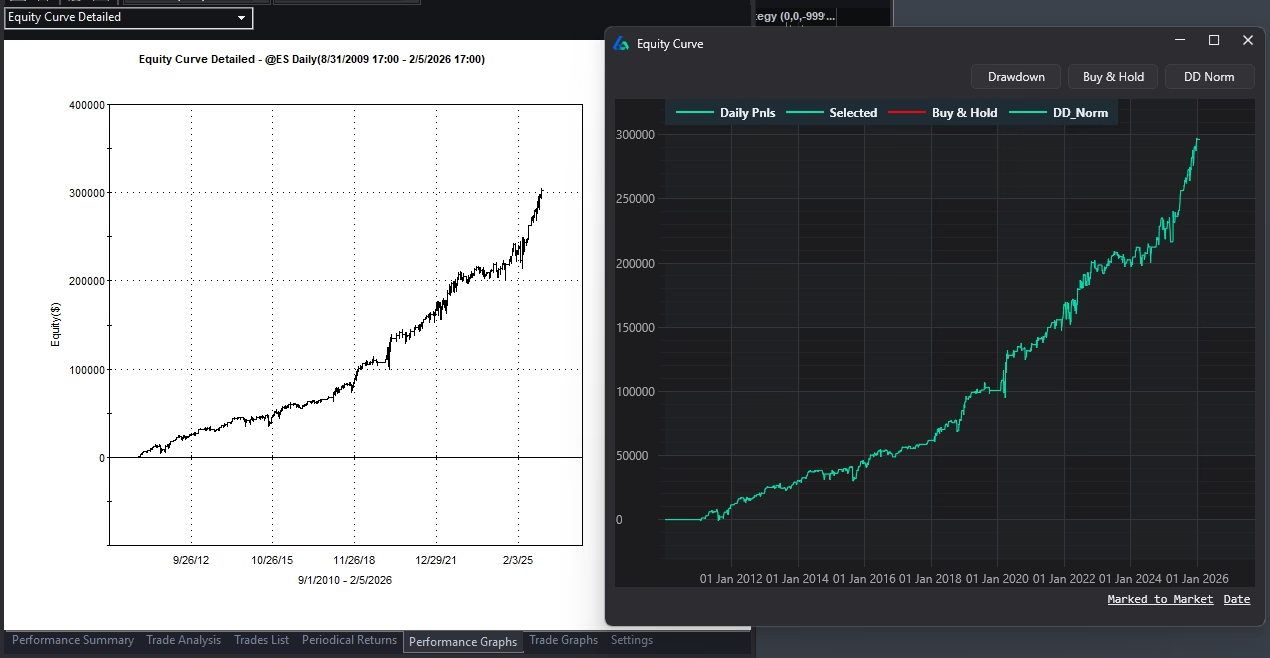
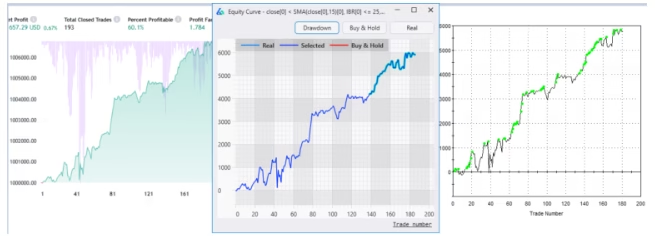
✓ Strategy A — Robust
Backtest 2010 – 2024
Steady equity curve
Consistent upward trajectory. Looks promising — but so does every curve-fit strategy at this stage.
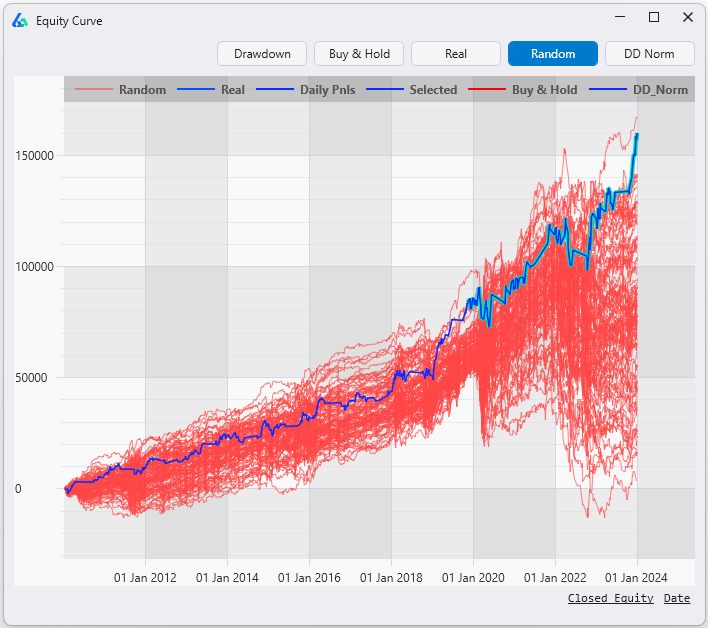
Vs. Random — Pass
Clearly beats random
Blue line obliterates the red random strategies. This signal meaningfully outperforms chance.
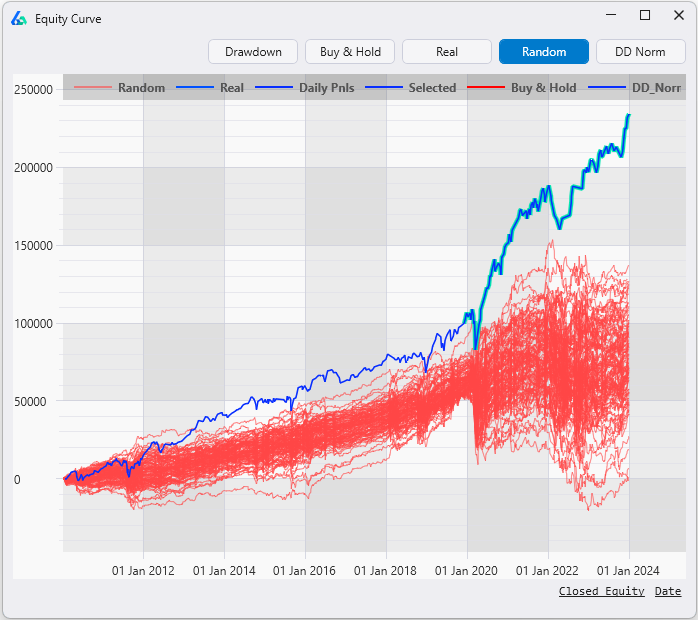
✓ PASS
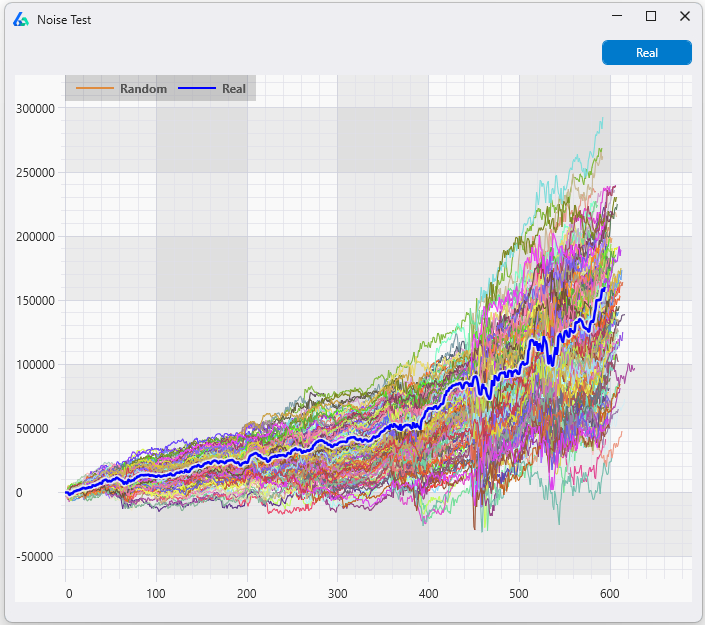
Noise Test — Pass
Tight clustering
1,000 synthetic series. The strategy holds up across all variations — tight band, consistent performance. Real signal.
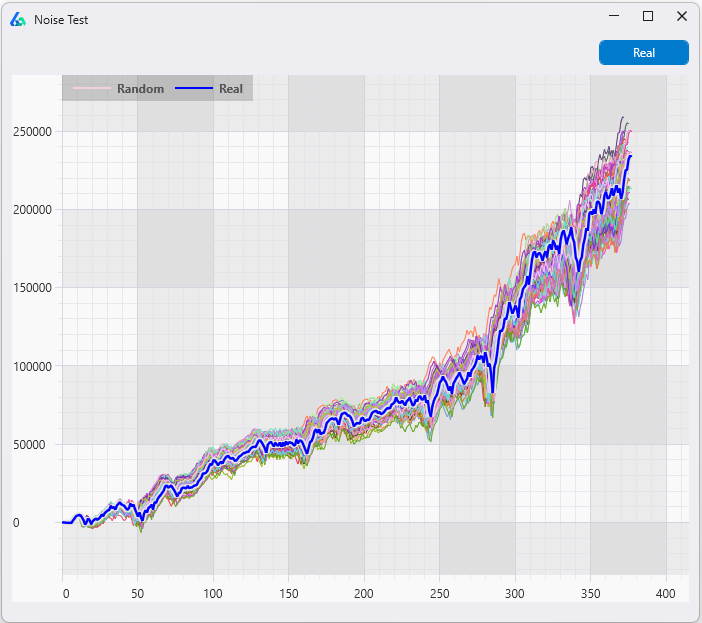
✓ PASS
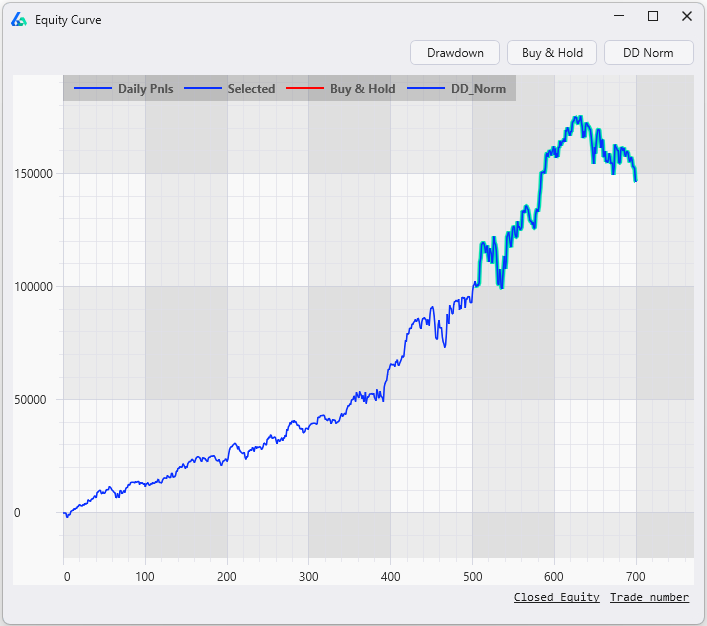
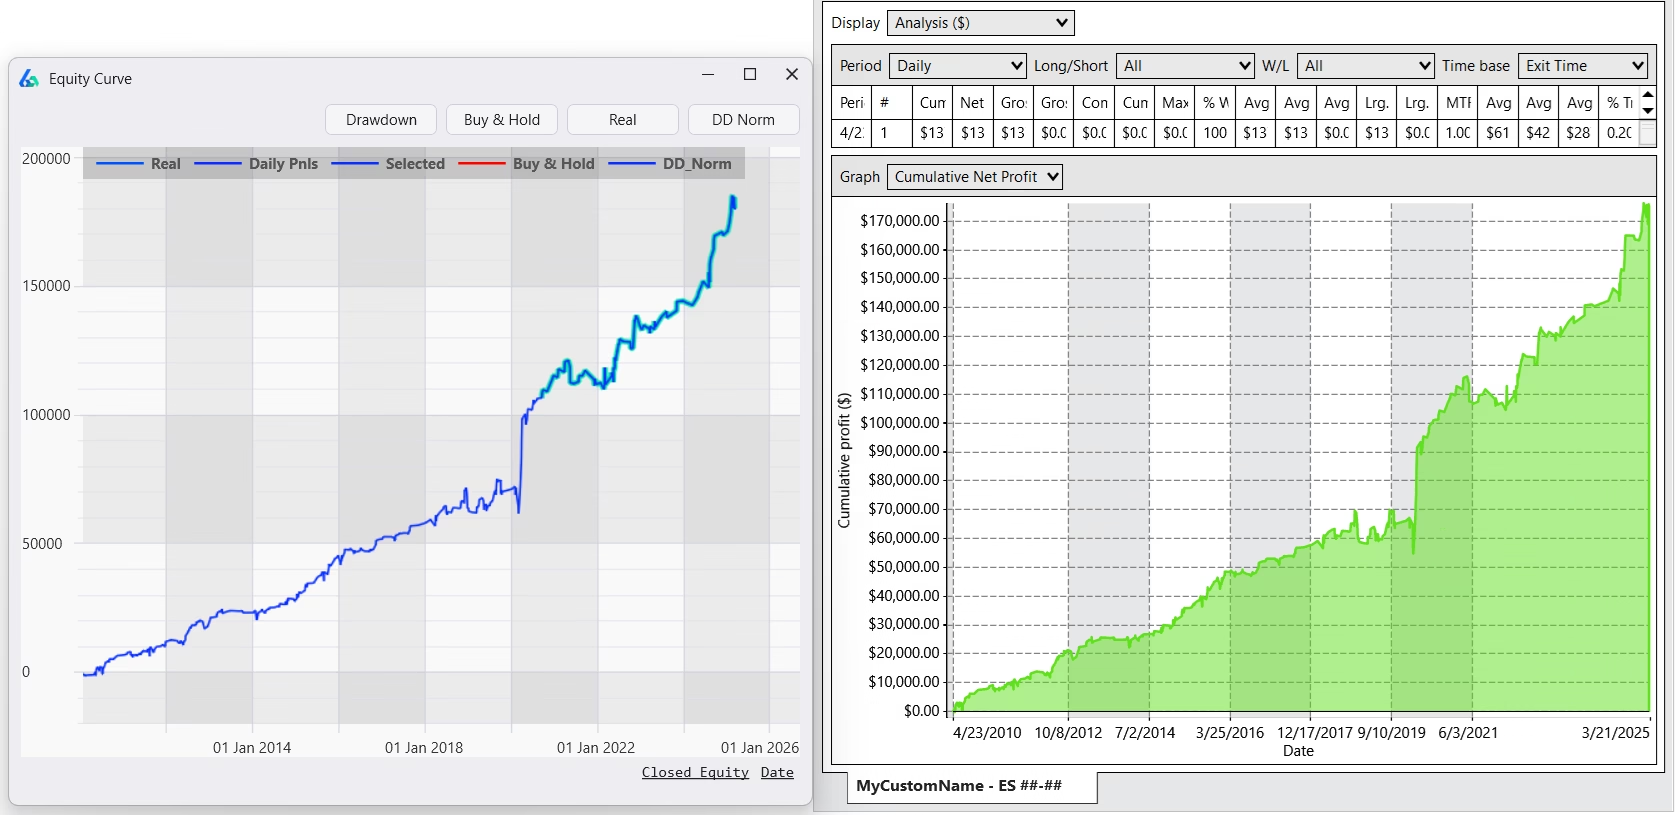
Forward Performance 2010 – 2026
Continues upward
Same rules, new data. The equity curve keeps climbing through data that didn’t exist when it was built.
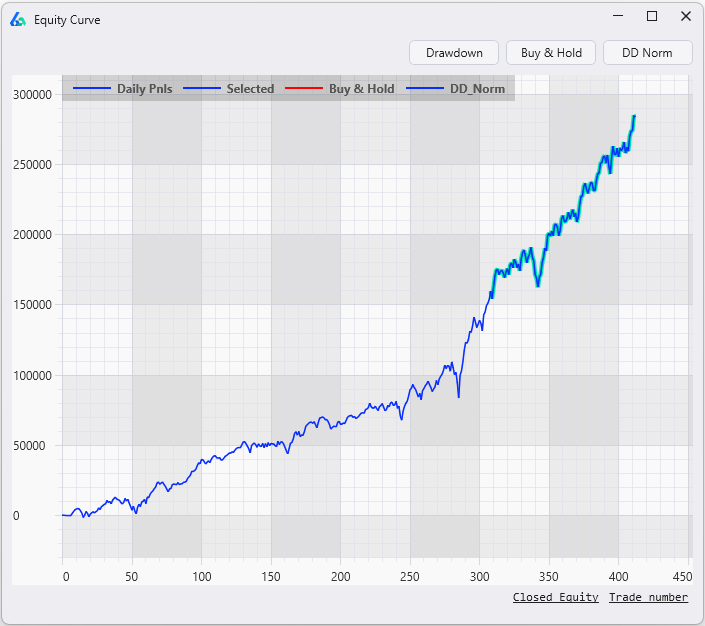
✓ HOLDS
✕ Strategy B — Curve-Fit
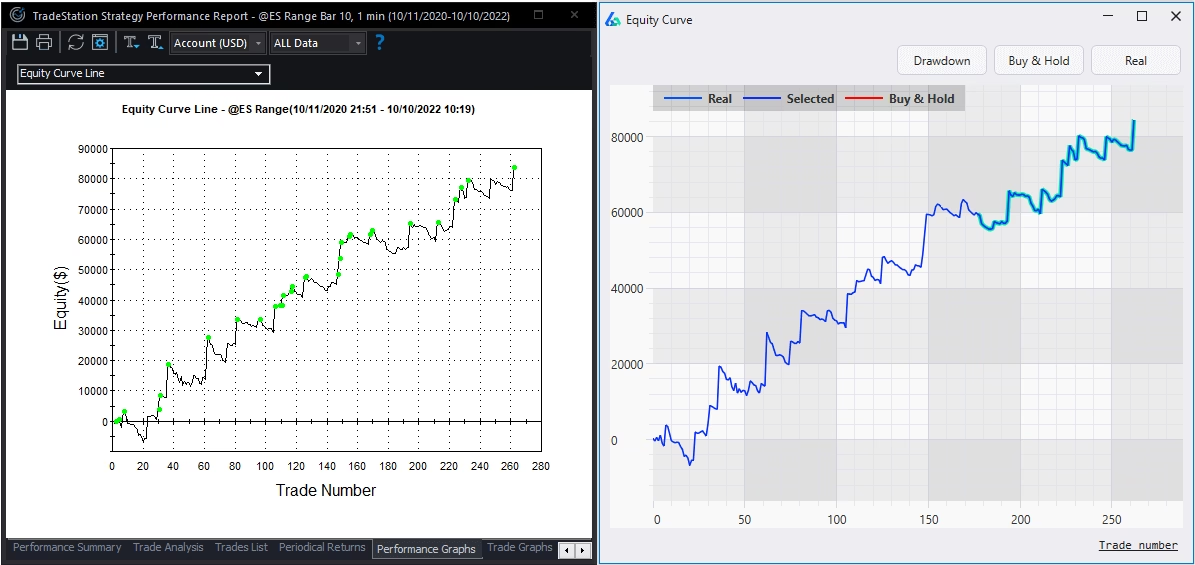
Backtest 2010 – 2024
Also looks great
Upward equity curve. Hard to tell the difference from Strategy A at this point. That’s the problem.
Vs. Random — Fail
Barely beats random
The blue line is buried inside the red noise. This strategy doesn’t meaningfully outperform random chance.
✕ FAIL
Noise Test — Fail
Wide dispersion
Massive spread across synthetic series. The strategy is fragile — small changes in data produce wildly different outcomes. Noise, not signal.
✕ FAIL
Forward Performance 2010 – 2026
Blows up
Same rules, new data. The curve-fit strategy collapses when it meets reality. This is why backtesting alone isn’t enough.
✕ FAILS LIVE
Out-of-sample or forward-period results are still based on historical data and do not guarantee future performance. Market conditions change and strategies may fail in live trading.
70+
Countries
7,000+
Signals
12+
Robustness Tests
8+
Platform Exports
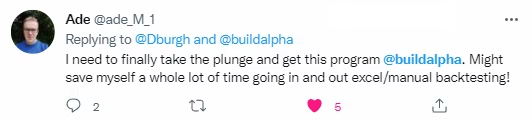
Real Traders
Two Traders. Different Markets.
Same Lesson.
Process over outcome. Discipline over excitement.
T1
How were you trading before?
“Mostly by hand. Chart patterns and 6 monitors. You know how it is.”
Trader 1 · Large Cap Stocks, Intraday
T2
How were you trading before?
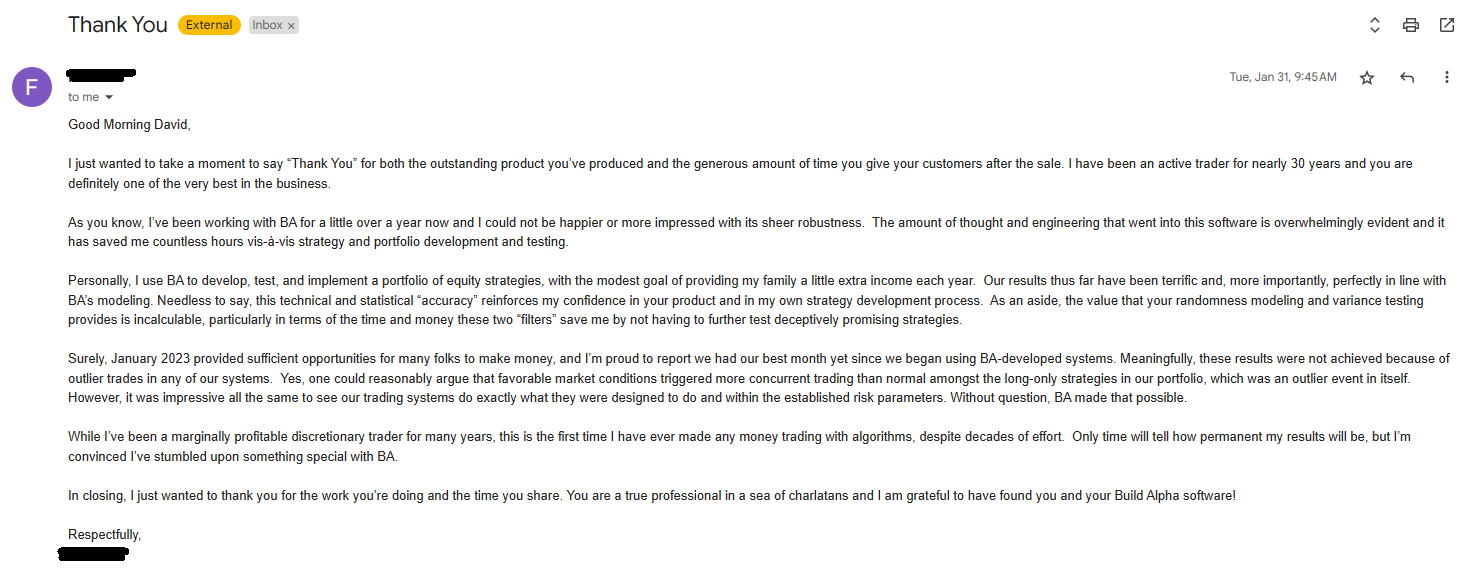
“I have been an active trader for over 30 years. This definition has evolved over time as you can imagine with changes in technology. I would say systematic but not always as well-defined as I should have been.”
Trader 2 · Daily Systems, CME / ICE / Eurex
T1
How would you describe your trading now?
“Boring at times but less frustrating. Stick to the plan and do not let myself beat myself.”
T2
How would you describe your trading now?
“Well defined. I know exactly what I am looking for and how it integrates with my other strategies. I have always been systematic but now I can automate a lot of the discovery process largely because I can test ideas much faster now.”
T1
What would you say to someone expecting instant profits?
“Save some money for when you really want to learn risk-taking.”
T2
What would you say to someone expecting instant profits?
“I have been doing this for 30 years and have yet to meet anyone who has achieved and sustained those profits.”
Their Actual Statements
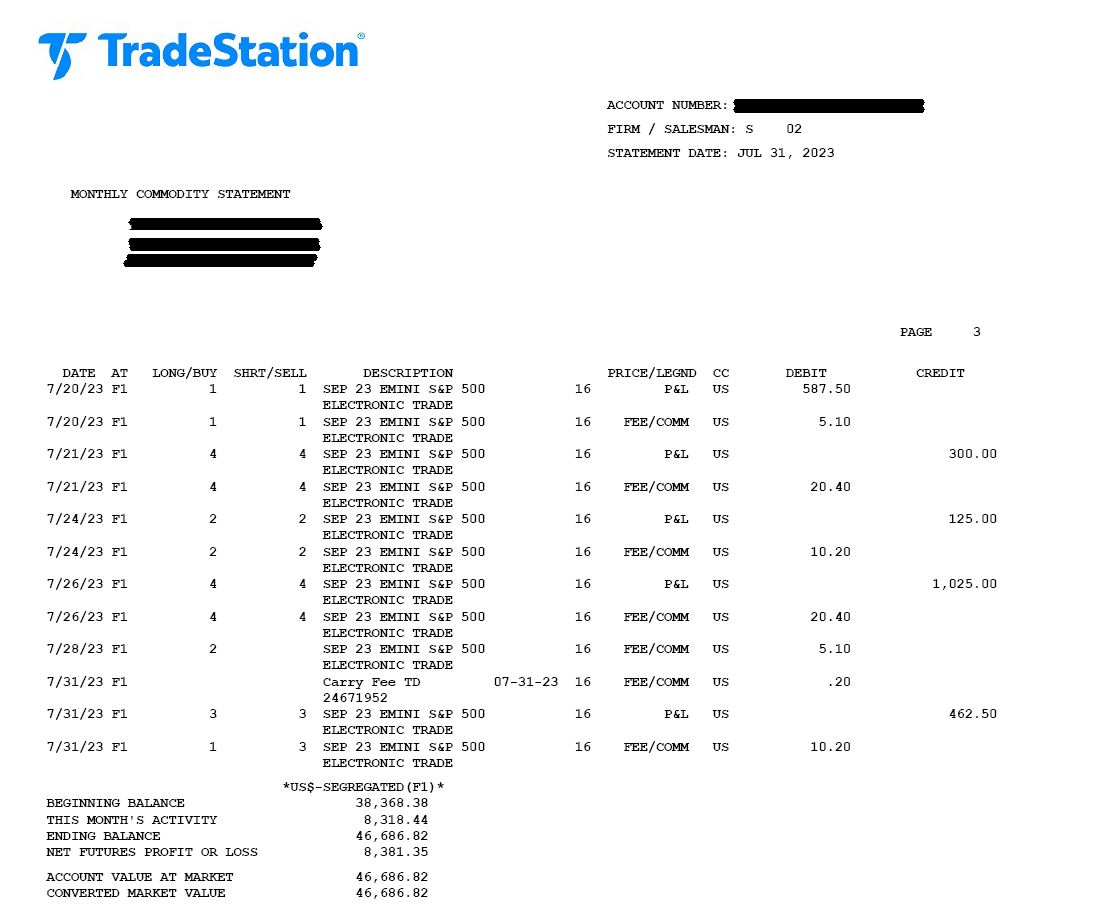
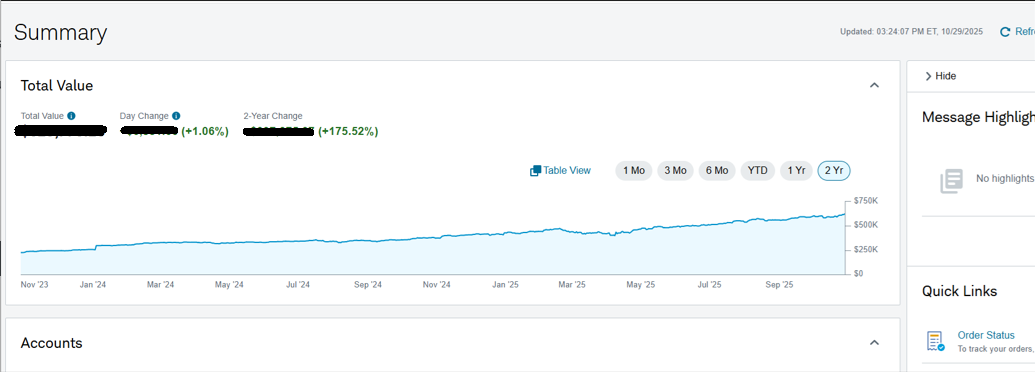
Click any image to enlarge
*Actual statements and emails from these users. These were cherry-picked from a handful of interviews because they 1) show different markets/timeframes and 2) both emphasize what I believe is most important: process over outcome, discipline, and robustness. Do enough of the little things right, for long enough, and “luck” finds you. At least that is our best chance.*
The experiences shared are individual user results and are not typical. Results vary widely and depend on market conditions, risk management, experience, and many other factors. Any references to profits or performance are illustrative examples and should not be interpreted as guarantees.
Get serious about trading
or stop trading.
If it were easy, everyone would win. The edge isn’t the strategy — it’s the process that finds and validates the strategy.
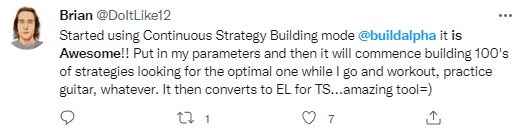
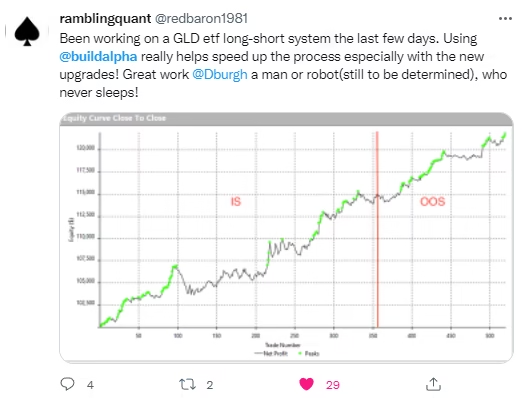
Community
What Traders Say


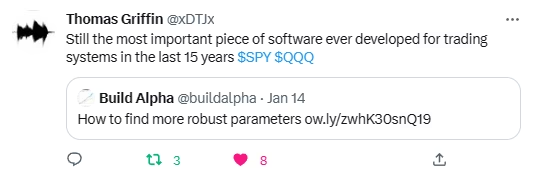
The experiences shared are individual user results and are not typical. AI-assisted strategy generation does not eliminate risk. Live trading results may differ materially from simulated results due to slippage, latency, and changing market conditions.
Included With License
Where do I start?
Build 50 strategies over my shoulder to learn the software. 10 video modules, 5.5+ hours. Normally $397 — included free with any license purchased before the deadline.
00Days
00Hours
00Min
00Sec
Licensing
Choose Your Plan
Every plan includes full access. Upgrade anytime — payments apply.
Quarterly
$447
per quarter
- Full software access
- All 7,000+ signals
- 12+ robustness tests
- Code gen for 8+ platforms
- Upgrade anytime
Most Popular
Annual
$997
per year
- Everything in Quarterly
- Priority support
- Early access to features
- Upgrade to Lifetime — payments apply
Upgrade to Lifetime for the difference + $197
Lifetime
$1,997
one-time
- Everything in Annual
- Lifetime updates — every feature, free
- 50-strategy training ($397 value)
- Never pay again
Build Alpha is a software tool for research and education purposes only. It does not provide investment advice or recommendations. Users are solely responsible for their trading decisions.
Questions
FAQs
How do upgrades work?
You can upgrade from any plan to any higher plan at any time. Your previous payments are credited toward the new plan — you just pay the difference plus a small upgrade fee.
Quarterly → Annual: $997 − $447 + $97 fee = $647
Quarterly → Lifetime: $1,997 − $447 + $197 fee = $1,747
Annual → Lifetime: $1,997 − $997 + $197 fee = $1,197
Quarterly → Lifetime: $1,997 − $447 + $197 fee = $1,747
Annual → Lifetime: $1,997 − $997 + $197 fee = $1,197
Do I need to code?
No. Build Alpha is point-and-click. You can optionally extend it with custom Python signals, if desired — but it is not required.
Is data included? Can I import my own?
Yes. Historical data is included back to 2006 and updated regularly. You can also connect to your broker or data provider for live and historical data, or import any file format — Build Alpha converts it for accurate use.
Is there a free trial or demo version?
There’s no free trial, but the Quarterly plan at $447 is designed to let you try Build Alpha with full access and minimal commitment. If you love it, upgrade — your payment applies. Extensive demo videos are at buildalpha.com/demo.
Will results match across platforms?
Exports are designed to match. Minor differences can occur due to data feeds, session settings, commissions, and execution assumptions. Step-by-step guides exist for each platform, and direct support is always available.
A few examples below – click to expand.
Can I get institutional or multi-seat licensing?
Yes. Contact david@buildalpha.com for seat pricing and deployment options.
Ready to Build Alpha?
Your backtest has something to tell you. Are you ready to listen?