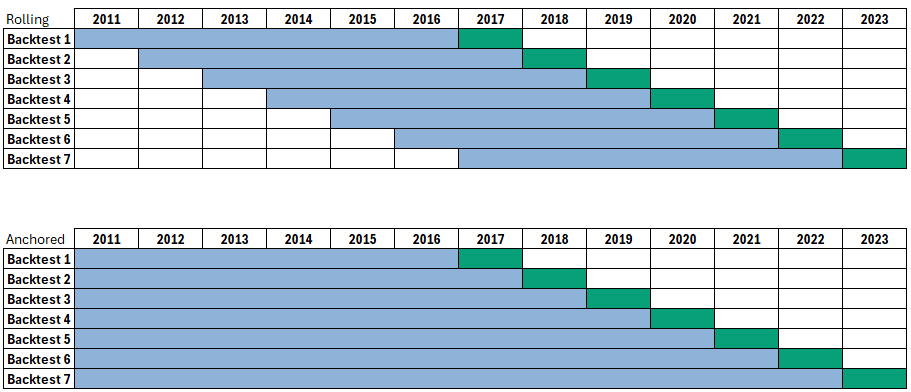
Walk Forward Optimization (WFO) is a technique used in trading strategy development to evaluate the performance of a strategy over multiple periods of data. Walk Forward Testing splits the historical data into multiple training and testing partitions where we optimize strategy parameters during the training data (in-sample data, blue below) and test the best parameter settings on the unseen (out-of-sample, green below) data.
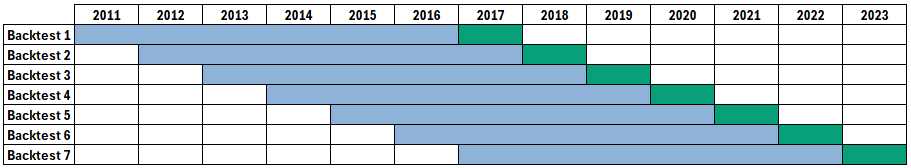
This process is then repeated until we “walk forward” through the entire historical data set which ultimately allows the trader to combine all out-of-sample data (green boxes) into one truly out-of-sample equity curve.
The idea is to simulate your trading system as if you were trading it starting back in time. How and when would you do parameter optimization and how does it impact strategy performance? Vital to understand prior to seeing new market data.
Do the optimal strategy parameters fluctuate a lot over time? If so, is this a robust strategy? Probably not and most likely curve fitting. Let’s discuss…
Please note this technique was originally developed by Robert Pardo in 1992 according to Walk forward optimization – Wikipedia
Walk Forward Analysis Settings
Walk Forward Tests have many settings. Below I will briefly describe each of the walk forward settings for those that are unfamiliar or want a refresher:
- how many data splits
- how to split the data
- strategy performance for pass/fail
- Objective function
- Optimization process
Walk Forward Runs
Walk Forward Runs are the number of in-sample, out-of-sample tests. Think of this as the number of green boxes in the above image or individual backtests. The above image has seven green boxes so we can say this Walk Forward test had seven runs.
If your entire test period covers a long history of price data, then creating more runs may better isolate differing market conditions which can ultimately lead to better understanding of when your strategy does well or poorly. Later we will discuss how to best determine this number.
Walk Forward Splits
Walk Forward testing requires the trader to determine the data split or out of sample data percentage to use. A split of 30% would mean that the out of sample data is 30% of the in-sample period length.
The above image uses six years of data for in-sample training and one year for the out-of-sample test. One divided by six is 16.7%. The above example image used 16.7% as the out of sample period.
Data split selection can have a material impact on optimal parameters and typically the more reserved data for out of sample, the better. Later we will discuss how to best determine this number.
Walk Forward Test Criteria
What is a passing test? What is a failing test? Before running any test, we must determine the risk adjusted objective functions we want to use to determine a pass or fail. Overall strategy profit and other performance metrics are the usual suspects.
Reminder, a strategy’s performance is only from the oos data periods.
Optimal Strategy Parameters
Finding the right optimized parameters can be a bit of a game of goldilocks. However, parameter values should be studied for your trading strategies.
Fluctuating parameters is usually a large telltale sign of overfitting. For example, a parameter that jumps from 12 to 47 to 23 to 35 to 55 to 13 is most likely curve fitting. Odds are you won’t find the right parameter setting for live trading – not a risk we should assume in our portfolios.
Additionally, does your strategy have many strategy parameters? This may require a different test set up than a simpler strategy with only one or two parameters.
Build Alpha shows optimal parameters for each walk forward test in the results window (pictured later).
Walk Forward Analysis Results
Walk Forward process is only concerned with the out-of-sample periods, and we can completely discard the in-sample results. The in-sample data is used solely for training parameters on past data hoping to find a robust set of values to give our trading strategy its best chance of survival (or outperformance).
Combined Out of Sample Windows
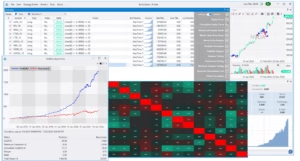
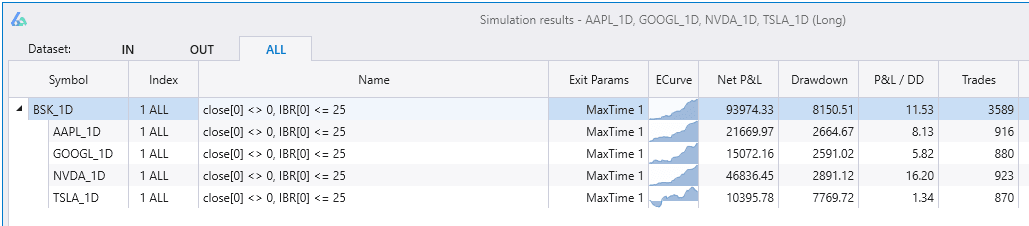
Walk Forward results are the cumulative performance from all the out of sample data periods (green boxes in first image of the post). Build Alpha automatically combines these so you can see one equity curve comprised of all the test periods (top row) as well as a breakdown of how each individual test period performed along with the optimal parameters for each test.
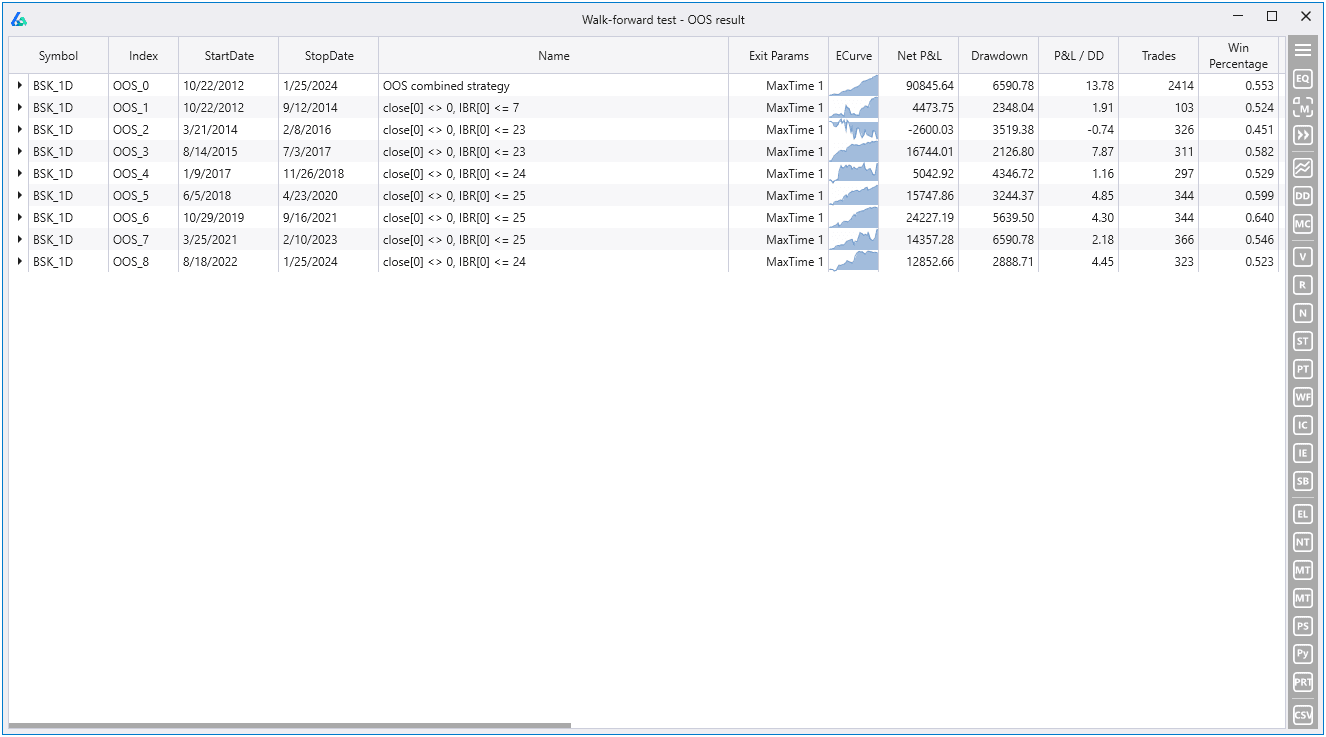
The above symbol is BSK for basket as this strategy operated on a handful of symbols. You can click the BSK expand arrow to further get individual results of each symbol during each test period.
Walk Forward Matrix
Since there is no ideal setting to cover the multitude of trading strategies possible then there can be no exact settings to use for Walk Forward testing that would cover every market condition, every time period, every strategy type.
However, we can run a Walk Forward Matrix where we provide various settings for both the number of runs and out of sample percent and have Build Alpha run all combinations.
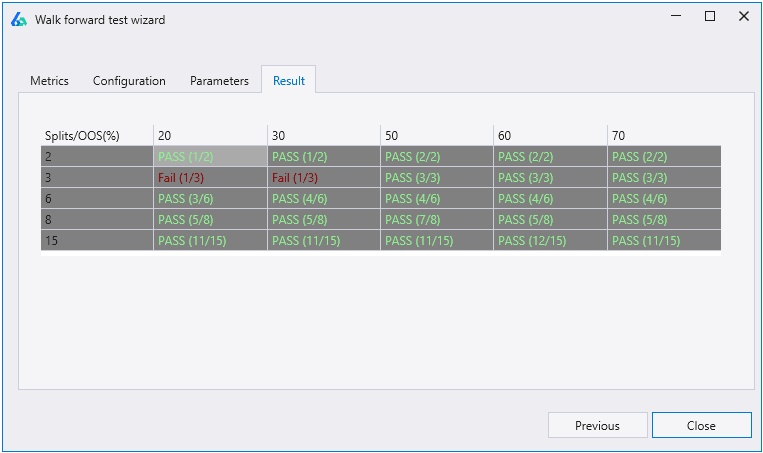
The results show how many runs at each out of sample percent passed the testing criteria. For instance, in the lower right cell, we had 15 runs each using 70% of the data as out of sample. 11 of the 15 runs passed the criteria so we see Pass (11/15).
Quick Interpretation
Do you see more failures with smaller out of sample percentages? Your strategy may overfit easily when given larger amounts of training data. Do you see more failure with larger out of sample data? Your strategy may require more constant attention and re-optimization (not ideal for those with automated ambitions).
Do parameter values change drastically from one period to the next or do they remain constant or within +/- 10% of previous optimal settings.
Are most periods performing well or consistently? What was unique about bad period(s)? Does it make sense to add a strategy that does well in that market environment to compensate for this strategy’s perceived shortcoming?
Anchored Walk Forward vs Rolling Walk Forward
There are two variations of walk forward testing one should understand. What I have been describing is the Rolling Walk Forward where each subsequent in-sample period is shifted forward before the next run (or backtest) begins.
An anchored walk forward optimization will not roll the in-sample period forward but instead anchor to the start date. This means that the training data for parameter selection expands in each successive run.
There are pros and cons to each approach, but most professionals utilize the rolling approach from my experiences. Keeping the training data size consistent to the out of sample data size is important to keep constant otherwise the trader must explore how altering training size impacts overall performance on its own.
Walk Forward Optimization Across Symbols
Build Alpha also enables you to run walk forward optimization across multiple symbols at the same time. That is, a strategy traded across various symbols can optimize all parameters across all symbols and return the results.
Simply highlight the BSK or basket row which is the summary of results of the strategy traded across all symbols selected then choose the Walk Forward button on the right-hand side.
Trading Strategy Example
Let’s do a simple example. I have cherry picked four stocks: AAPL, NVDA, TSLA, GOOGL. Obviously, this is a compromised or biased study because we all know these stocks are big winners regardless.
However, I want to demonstrate that even with a biased test that WF OOS can lend valuable insights and provide us a use case to interpret some results.
The strategy used buys $10,000 worth of stock when price closes in the bottom 25% of the bar’s range and sells one bar later. IBR or internal bar rank is the main signal.
Walk Forward Data Results
The strategy rarely changed parameter thresholds during each OOS test period which is generally what we want to see. We had one period where threshold deviated a lot down to 7 but most of the other periods settled on values near our original test value of 25.
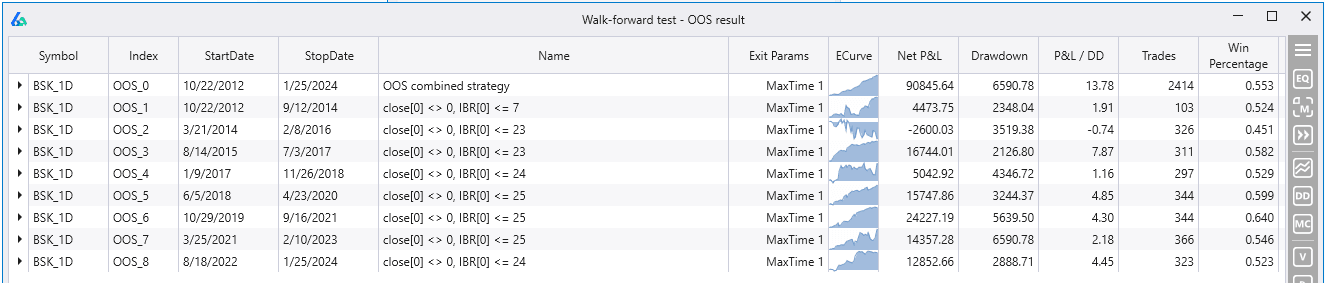
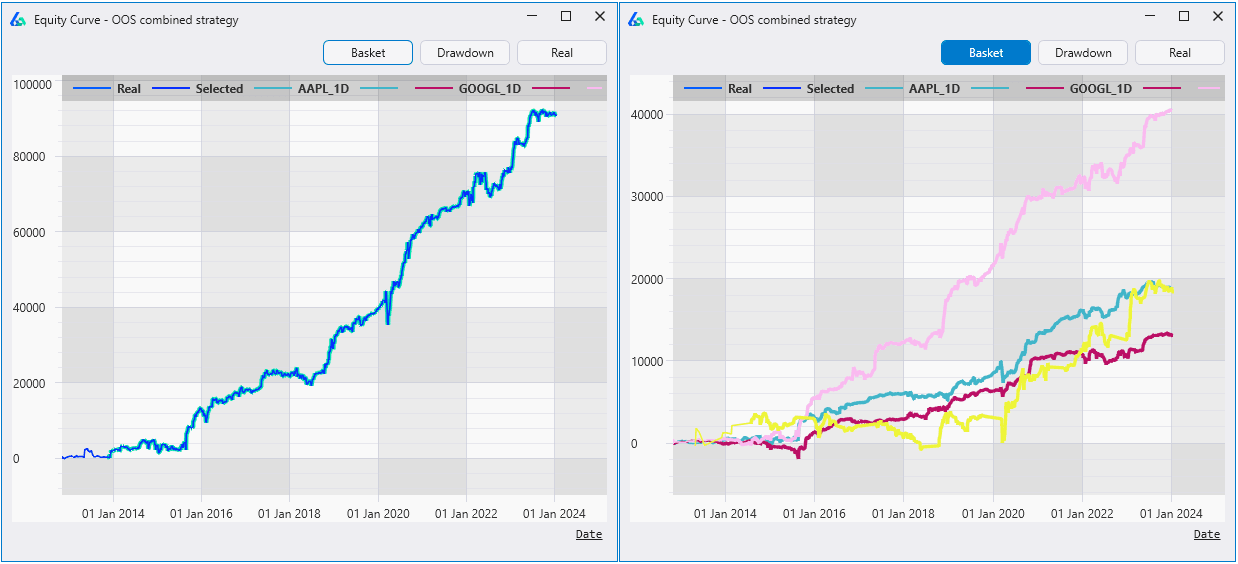
Double-clicking on the top row will show the combined OOS equity curve across the basket and Build Alpha also gives the ability to view the individual symbol’s combined OOS performance by clicking on the Basket button (pictured on the right).
Best Walk Forward Optimization Software
Build Alpha is the most comprehensive automated trading strategy development software available and now supports the most advanced Walk Forward Optimizer. I could not be prouder of what this software has become over the past few years and has a wide variety of cutting-edge, one-of-a-kind features to keep us out in front of the market.
How to set up Walk Forward Testing in Build Alpha
Below is a simple 5 step walk-through setting up the Walk Forward Optimization and testing in Build Alpha – all point-and-click.
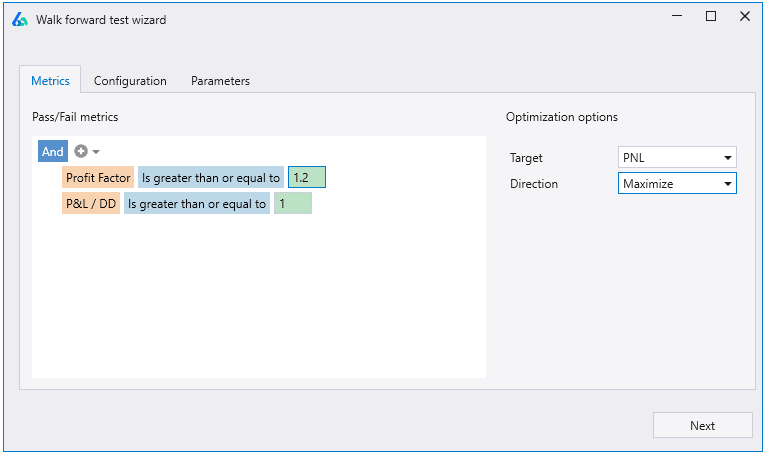
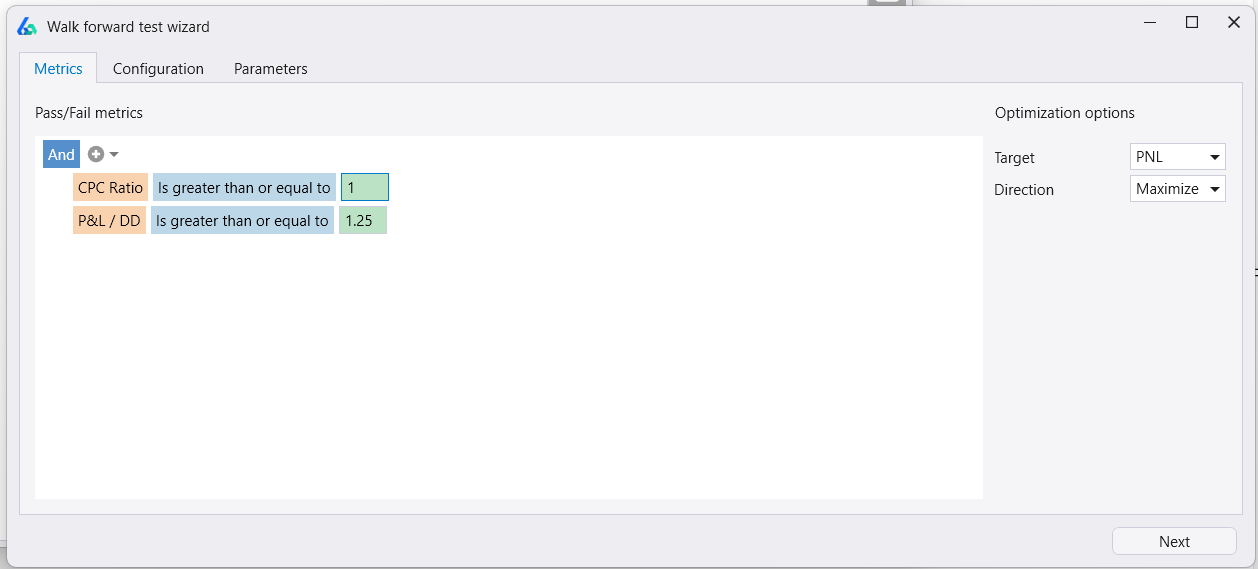
Step 1 – Set Pass Criteria
The no-code editor allows traders to set any condition they deem passing. These are evaluated each run. The trader also sets the Target or objective function (fitness) at this stage. Below optimizes for Max Profit & Loss and each out of sample will be scored a pass if CPC Ratio is one or above and Profit & Loss to Drawdown ratio is 1.25 or higher.
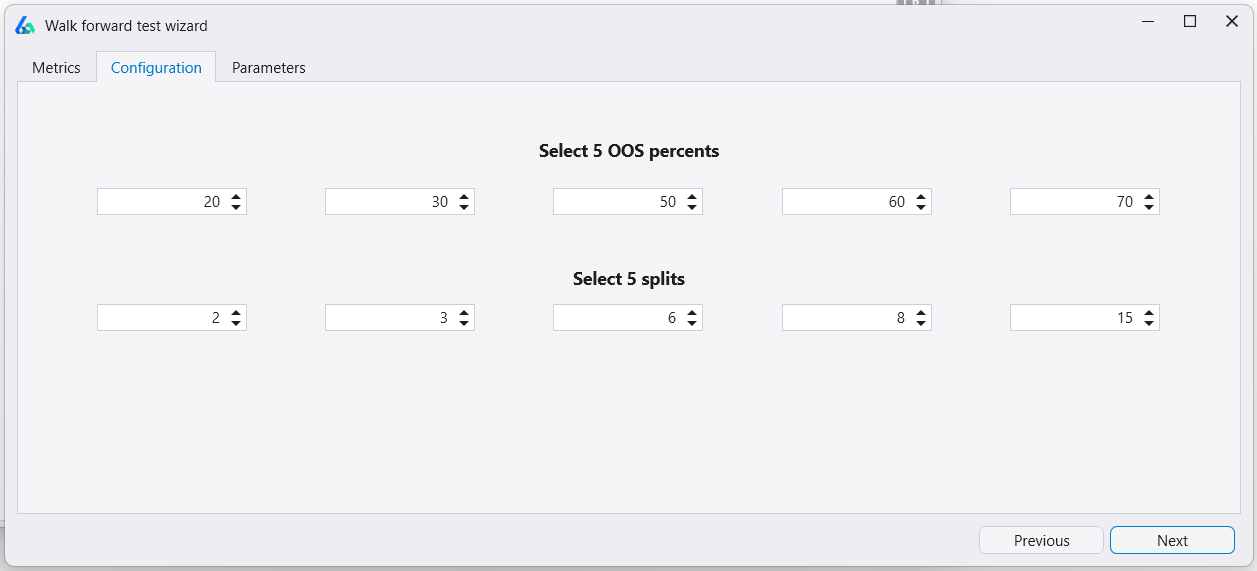
Step 2 – Set number of runs and OOS splits
Build Alpha runs a 5×5 matrix by default. However, the trader can configure each cell’s out-of-sample percentage and number of splits. Set any input to negative one (-1) to disable. For instance, setting all except the first row’s input and the second row’s input would run exactly one Walk Forward Test with 20% out-of-sample and 2 splits.
Step 3 – Set Parameters
Choose to optimize entries, exits or standard exits such as hold time, stop loss, etc. Set base, max and step value which is what Build Alpha is allowed to use during the optimization process.
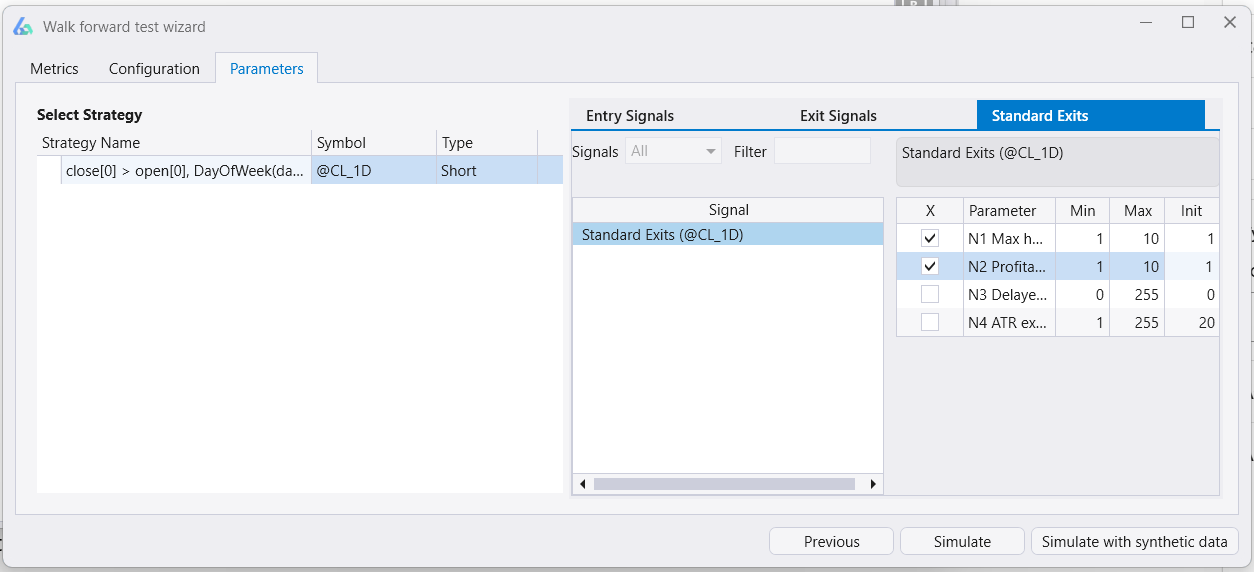
Step 4 – Simulate
Simulate will run your Walk Forward Matrix and return the results showing a pass/fail score for each cell.
Step 5 – Inspect Walk Forward Results
Click inside any cell to pull up the results window. View performance metrics and equity curves of every split. Validate results with all of Build Alpha’s robustness tests.
Walk Forward Optimization with Synthetic Data in Build Alpha
The Build Alpha walk forward optimizer has the unique ability to add synthetic data to the walk forward optimization process. The synthetic data can be generated with either noise adjusted data or Monte Carlo permutated data.
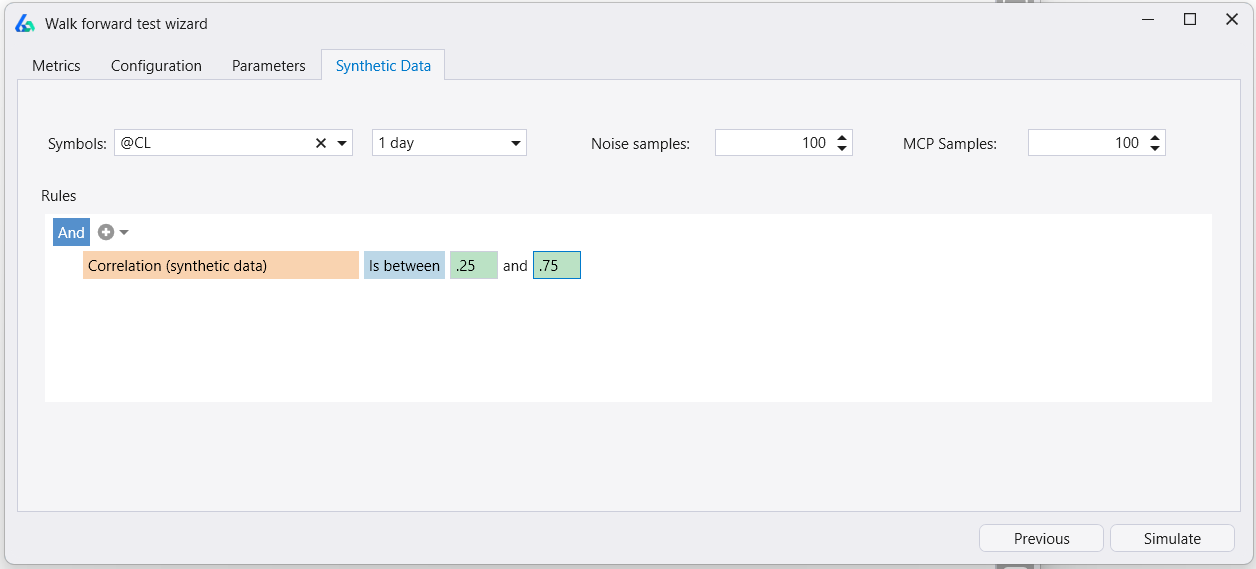
Step 6 – Synthetic Data (optional)
Before clicking Simulate, choose Simulate with Synthetic Data. Select the symbol, timeframe, and the data-generation methods. Then set rules to decide which synthetic data sets will be used in the Walk-Forward process.
In the example below, Build Alpha creates 200 synthetic data series, but only includes those that have a correlation between 0.25 and 0.75 with the original historical data.
The ability to qualify synthetic data enables specific stress testing scenarios. Perhaps you only want synthetic data that has certain characteristics such as larger drawdowns than the original OHLC data or has annualized volatility that is 1.25x higher.
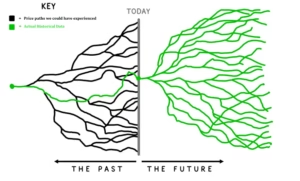
In short, this feature enables testing a strategy on the single known historical price path but also on possible price paths and permutations that could (and maybe will) have taken place.
Why optimize for the known past when we really need to optimize for various possible unknown futures?
After simulating with synthetic data, Build Alpha will show you the WF results as well as the WF results on the synthetic data. These synthetic data series results are also included in the Pass/Fail scoring! Optimizing on synthetic data can also lead to more robust parameters working across a variety of price paths as opposed to only working on the single known history.
To read more about synthetic data and how to utilize in Build Alpha please check these out:
TradeStation Walk Forward Optimizer vs Build Alpha
TradeStation does offer a walk forward optimizer, but it is slower than Build Alpha’s as TradeStation is still 32-bit (vs. 64-bit). Additionally, Build Alpha is optimized to use all CPU cores and gives the trader the added ability to add synthetic data series to the process as well as create custom pass/fail metrics. You can read about TradeStation’s here: About the Walk-Forward Optimizer (tradestation.com)
Read more: TradeStation Strategy Generator
Summary
Walk forward testing is a technique to divide the historical data into various smaller backtests each with its own in-sample and out-of-sample data periods. Walk forward testing then walks the strategy forward through each of these subtests or smaller backtests and ultimately combines each of the smaller backtest’s out of sample performance into one master out of sample performance.
This test has some pitfalls like all other techniques but this blog is geared more as an introduction to the feature and utility. For questions, concerns and comments please email me any time.
Here are a few other blogs that may be of interest: