Randomized Out of Sample
What is Out of Sample Testing?
Out of sample testing is purposely withholding data from your data set for later testing. For example, let’s say we have ten years worth of data and select to designate the last 30% of the data as out of sample data. Essentially what we do is take the last 3 years (30%) of the data set and put it in our back pocket for later use. We then proceed to create and optimize trading strategies using ONLY the first 7 years of data or the “in-sample” data.
Let’s assume we find a great looking strategy that performs extremely well on the first 7 years worth of data. What we would then do is take the last 3 years worth of data, or our out of sample data, out of our back pocket and proceed to test our strategy on this “unseen” data.
The idea is… if the strategy still performs well on this unseen, out of sample data then it must be robust and we can have increased confidence it will stand the test of time or at least in how it will perform on future market data.
To read more about out of sample testing please check out these
- Out of Sample Testing Complete Guide
- Out of Sample Data | How the Human Can Add Value to Automated Trading Process
Pitfall of Out of Sample Testing
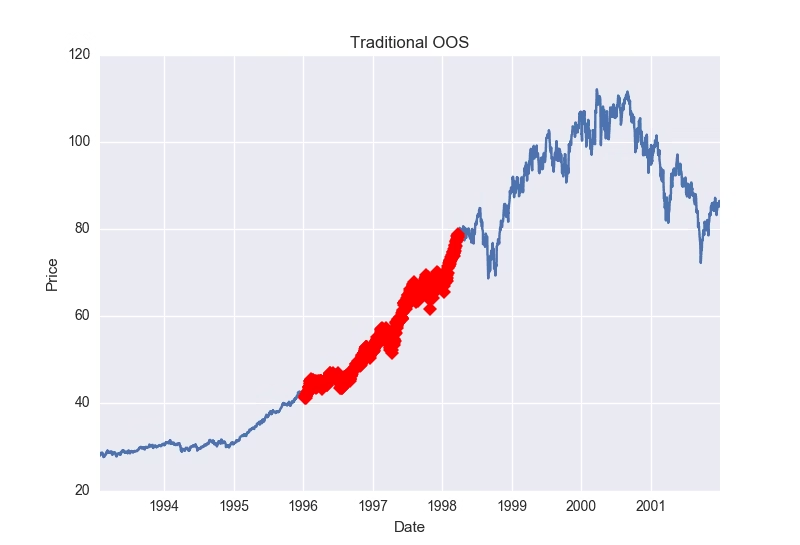
However, there is a major pitfall to the above approach given certain data sets. What if our amazing looking strategy happened to be long only and only performed well on our unseen, out of sample data because the last 3 years (our 30%) were extremely bullish. See picture below (red marks last 30% of data). Is it possible any long strategy would have passed this out of sample period?

What’s a solution? What if we use the first 30% of the data instead of the last 30%? What if we use some middle 30% of the data? Well, we actually still run the risk that any continuous 30% of the data may be extremely trendy. Here is a photo showing a strong trend in the beginning 30% of a data set.

Here is a photo showing a strong trend in the middle 30% of a data set:
Randomized Out of Sample Testing
The answer? Let’s take our original backtest results and run them through a randomized out of sample test. First, we randomly select dates until we have randomly selected 30% of the dates from our data. Now we have a “randomized out of sample” period to put in our back pocket. Basically, we will then run through our entire data set but filter out any trades that would have occurred on our now randomly selected, out of sample dates.
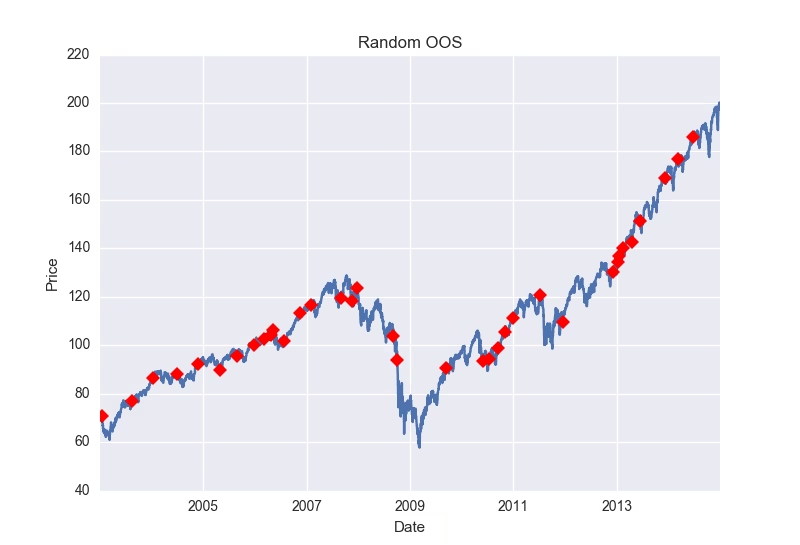
Then we can view the results of the trades that only took place on our randomly selected out of sample dates as a new “quasi-out of sample” equity curve. We have now significantly reduced the chances that any successful out of sample performance is solely due to some underlying trend or market regime as our out of sample data is now no longer continuous. Here is an example of random 30% of data selected for out of sample.

Is one test enough?
However, one more problem remains. What if we randomly created a trend or favorable market regime through our random sampling/selection? That is, we’ve randomly selected 30% of the dates and when they’re put in chronological order for our out of sample testing they coincidentally create a massive up trend that could skew our new out of sample results?
The answer? Run this test 1,000 times where we re-select a new random 30% of the dates (or bars) each time to act as our out of sample period. Some may create a favorable market regime, but we can see how our sample strategy does over a variety of randomly created regimes or out of sample periods.


Build Alpha Solution
Build Alpha offers this complete process and test with the click of a button. The leftmost graph below is the in-sample equity curves from the 1,000 runs. These are basically trades that occurred on dates that were NOT randomly selected to be part of the out of sample period. The middle chart is our randomized out of sample test. These are the equity curves from the 1,000 runs of the trades that occurred on the dates that were randomly selected. The thick blue line on the left and middle graph are the in and out of sample tests from our original back-test. The rightmost chart is simply the original back-test for reference.
Analyzing Randomized Out of Sample Results
Example 1
The example below shows our original backtest’s out of sample equity curve to be at the very top of the distribution of all the random out of sample tests (middle chart below). This is a sign that the underlying data contributed quite favorably to our results and may have produced unrealistic or unrepeatable out of sample results (most likely something like the first picture of this post where the last 30% of the data is considerably bullish).

Example 2
In the picture below I’ve displayed a simple demonstration that would show a “passing” random out of sample test or a situation where you can feel comfortable the original out of sample period is a “fair” period of time. The middle graph’s thick blue line (our original out of sample results) is in the middle of the random out of sample distribution. This means as we randomly selected random out of sample periods we created some out of sample equity curves that had better results than our original backtest and some that had worse results than our original backtest. This can only mean that our original out of sample period was “fair” and did not overly contribute to the favorable results, but rather the favorable results come from the strategy itself.

Takeaways
We know we want to test on “unseen” data, but also want to reduce the chances that an underlying trend produced favorable out of sample results. In order to avoid being fooled by a favorable out of sample period, we randomly create thousands of out of sample periods and want to see general profitability across them all.
If the original backtest’s out of sample line is significantly greater than all the randomized out of sample equity curves then we can conclude we had originally selected an overly optimistic out of sample period that contributed too greatly to our strategy’s out of sample success (similar to the first photo in this post).
Additionally, if our original backtest’s out of sample line is one of the worst performers compared with the randomized out of sample equity curves then we can conclude the original out of sample period chosen may actually be too unfavorable (and throwing the strategy away based on out of sample results alone may be ill-advised).
All in all, Randomized Out of Sample testing is just one more test Build Alpha offers to provide the utmost confidence a strategy will perform to expectation moving forward.
Thanks for reading,
Dave
To read about more advanced tests to create confidence in your trading strategies check out this complete Robustness Testing Guide.
Admiring the commitment you put into your blog and in depth information you present.
It’s great to come across a blog every once in a
while that isn’t the same unwanted rehashed information. Wonderful read!
I’ve saved your site and I’m adding your RSS feeds to
my Google account. https://www.facebook.com/Vitamin-Shoppe-Coupon-Codes-1880283042254350/
Much appreciated! It is nice to know my endless ramblings aren’t falling on deaf ears.
Cheers,
David
Your ramblings are not going unheard! Trust me!
Much thanks!
Valuable info. Lucky me I found your web site by accident, and I’m shocked why this accident didn’t happened earlier! I bookmarked it.
Thanks!
This kind of method is very useful to detect overfitting for strategy which uses only one asset. Do you have a method for a strategy which use a bi/multivariate relationship of assets?
Thanks for reading. In short, yes. But you could also just maintain the bi/multivariate relationships while resampling. Whether it is the data or the original signals.
Very informative and knowledgeable article written here. I am impressed by the amount of thoroughly testing involved to find an edge. Very good article. The blog is definitely saved.