Gamma Exposure (GEX):
Dealer Positioning Signals for Algo Trading
Gamma exposure measures how much option dealers must buy or sell to stay hedged as the market moves. That hedging either dampens price or amplifies it.
What Is Gamma Exposure (GEX)?
Gamma exposure (GEX) is a dollar-denominated estimate of how much stock or futures option dealers need to buy or sell to keep their books delta-neutral when the underlying moves. It is built from the gamma of every open option contract, weighted by open interest, and summed across strikes and expirations.
Market makers sell most of the options that retail and institutional traders buy, and they hedge those positions continuously. Whether that hedging leans against the market's move or with it depends on the sign of their net gamma. GEX condenses that into one number per day that we can use to build signals.
SqueezeMetrics, who popularized the metric, showed in their original white paper that realized S&P 500 volatility is lowest when GEX is high and rises sharply as GEX falls below zero. The largest intraday moves cluster in negative-gamma conditions. That relationship is what makes GEX useful as a regime signal for systematic strategies.
Positive vs. Negative Gamma: Two Regimes
Everything about GEX comes down to which side of zero it sits on, and how far.
Dealers are net long gamma. As price rises they sell, as price falls they buy. Their hedging leans against the move, so ranges contract, moves fade, and price tends to pin near large strikes.
Dealers are net short gamma. They buy into rallies and sell into declines to stay hedged, which pushes price further in the direction it was already going. Volatility expands and trends extend.
Why This Matters for Strategy Design
The same breakout rule can be a great strategy in negative gamma and a losing one in positive gamma. A mean-reversion rule is the reverse. GEX hints at market environment and adds context a price-only backtest is missing.
Does the Relationship Still Hold? GEX vs. Next-Day Range, 2004 to 2026
The claim behind every GEX strategy is that dealer positioning predicts how much the market moves next. Claims like that deserve a check, so I ran it on the data Build Alpha ships: daily GEX and GEX500 against the next session's ES range and return, January 2004 through September 2026, 5,596 sessions.
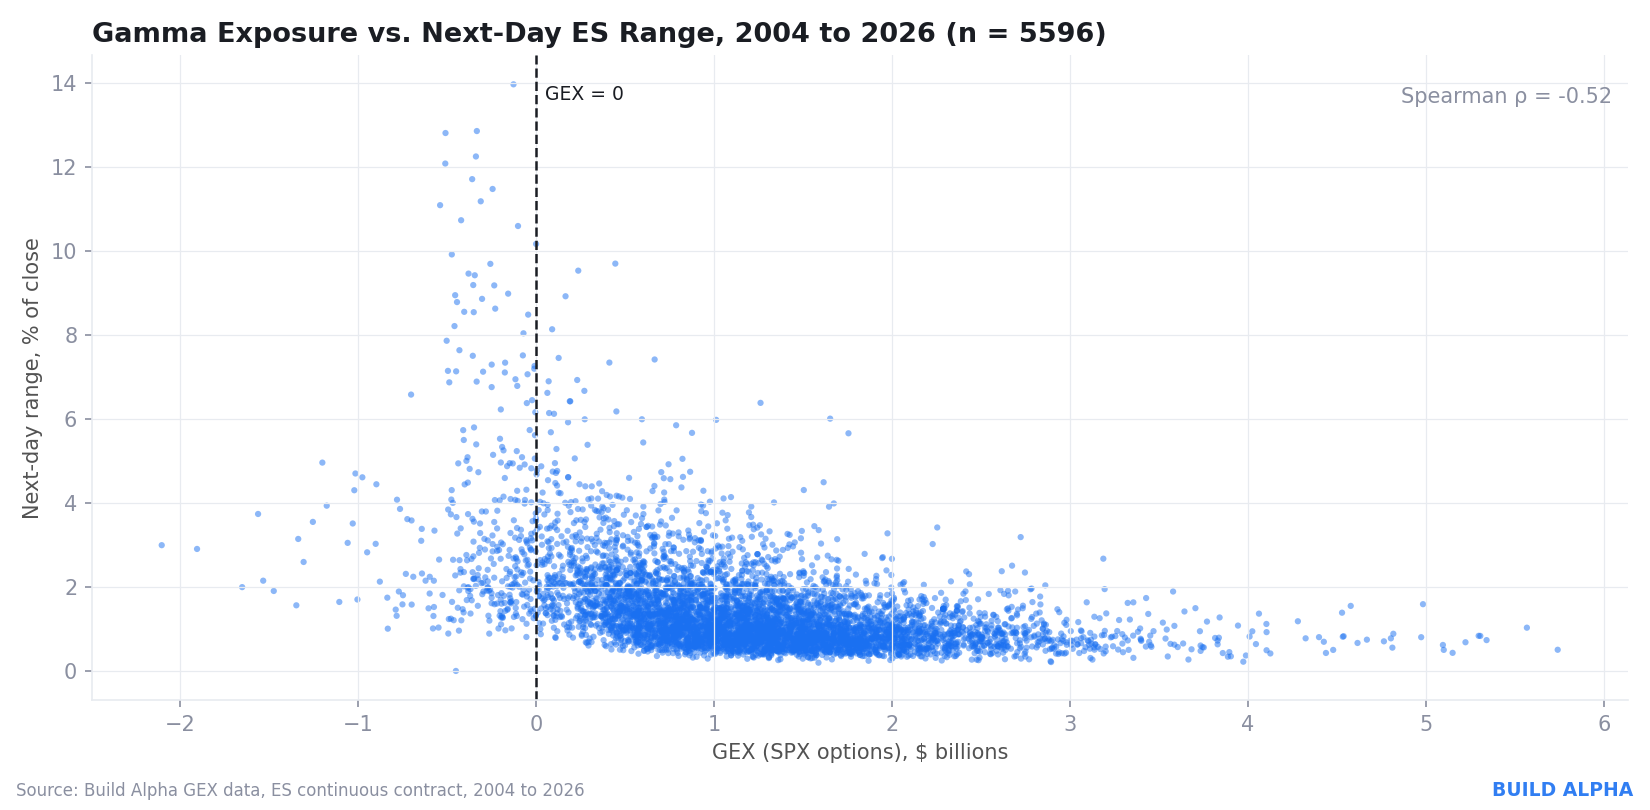
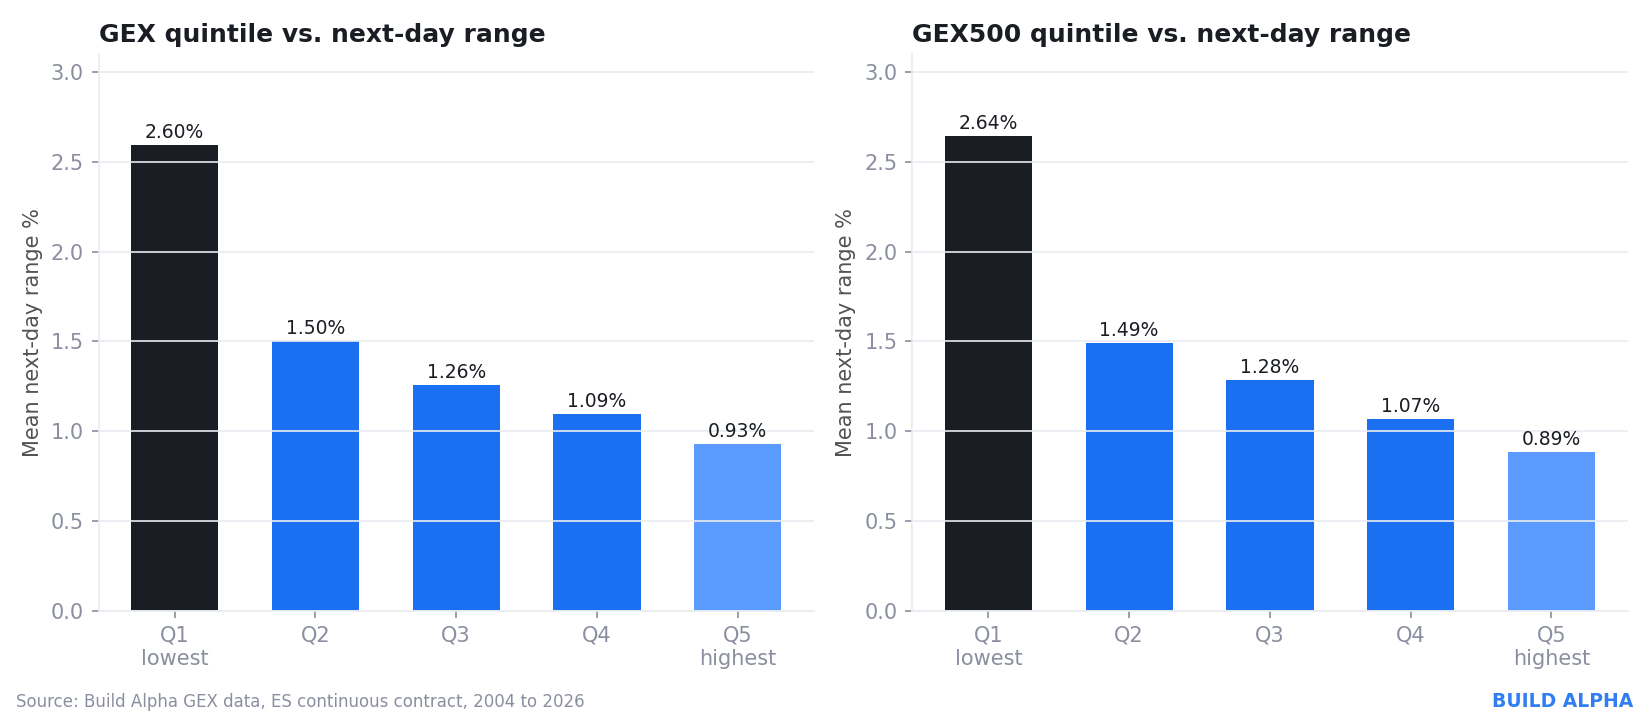
The pattern is not subtle. Sorting sessions into GEX quintiles:
| GEX quintile | Sessions | Mean next-day range | Median | Next-day return std dev |
|---|---|---|---|---|
| Q1 (lowest GEX) | 1,120 | 2.60% | 2.05% | 2.03% |
| Q2 | 1,119 | 1.50% | 1.31% | 1.09% |
| Q3 | 1,119 | 1.26% | 1.07% | 0.87% |
| Q4 | 1,119 | 1.09% | 0.94% | 0.76% |
| Q5 (highest GEX) | 1,119 | 0.93% | 0.84% | 0.58% |
The lowest-GEX quintile sees a next-day range nearly three times the highest quintile, and the relationship is monotonic across all five buckets. The 346 sessions where GEX was actually negative averaged a 3.6% next-day range against 1.3% for the rest. GEX500 gives the same picture with a slightly stronger rank correlation (−0.56).
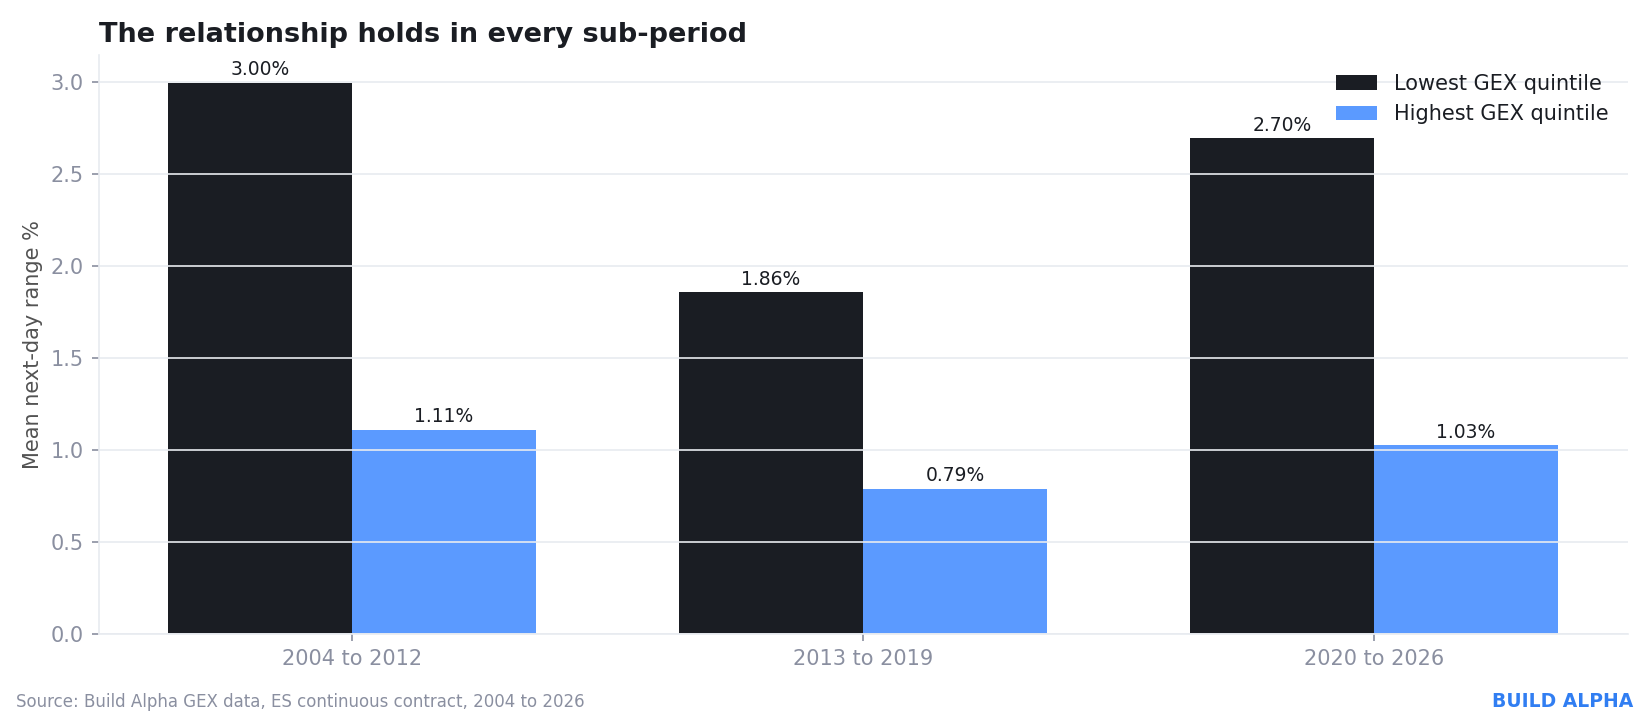
It Holds in Every Sub-Period
A relationship this well known could have been arbitraged away. This has not been (yet). Splitting the sample into three eras, the lowest quintile out-ranges the highest in each one, including the most recent:
Is It Just Recent Volatility?
A fair objection. Let's check. GEX tends to be low after volatile days, and volatility clusters. To check that GEX adds something beyond "yesterday was wild," I measured next-day range relative to the prior 20-day ATR instead of in raw percent. The rank correlation shrinks but stays clearly negative (−0.20 for GEX, −0.25 for the SPX-options-only series), and the lowest quintile still out-ranges the highest by about 30%. GEX carries information that recent realized volatility alone does not.
What This Means for Strategy Design
Use GEX to size the expected move. Low or negative GEX is the environment for breakout entries, wider stops and targets, and smaller position size. High GEX is the environment for fading extremes, tighter targets, and premium selling. Pair GEX with your entry logic and let Build Alpha test which combinations hold up.
Method Notes
ES continuous contract, session close to session close, range measured as (high − low) divided by the prior close. GEX and GEX500 are the daily values Build Alpha ships, read at the 16:15 close and compared to the following session. The continuous contract is back-adjusted, so prices were de-adjusted with anchor points before computing percentages; the ATR-relative check is unaffected by that adjustment. Sessions before 2004 were excluded due to available data.
Where GEX Data Comes From
GEX is computed from the options chain, so anyone with strike-level open interest and a pricing model can build it. Several vendors publish a daily aggregate for the S&P 500, and Build Alpha ships gamma exposure as a built-in, pre-processed data series back to 2002 so you can use it as a signal without collecting or calculating anything.
Build Alpha carries two gamma exposure series, and most of the custom signals use both:
Gamma exposure computed from S&P 500 index (SPX) options. The single number most GEX research refers to.
Gamma exposure aggregated across the options on all S&P 500 component stocks. A bottom-up view of the same market.
Index options and single-stock options are traded by different participants for different reasons, so the two series do not always agree. When both are high, dealer positioning is one-sided across the market. When they diverge, the gap can be telling.
GEX vs. GEX500: Why the Spread Matters
A single GEX reading can tell you the regime. Comparing two GEX series can tell you whether the regime is broad or narrow, and whether it is strengthening or unwinding. This gives four distinct things to measure:
- Sign: is GEX above or below GEX500?
- Size: how large is the gap in dollars, or as a ratio?
- Change: is the gap widening or narrowing versus the prior period?
- Rank: where does today's gap sit against the last year of readings?
Deriving Signals from GEX Data
Raw GEX is a dollar figure that drifts over the years as option volumes grow. A reading that was extreme in 2015 is ordinary today. So, exactly as with the COT Index, the useful signals come from normalizing the series first. The custom signal file uses four techniques:
Percentile Rank
Where does today's value sit relative to the prior 252 periods, roughly one year of daily data? Above the 90th percentile is an extreme high, at or below the 10th an extreme low. This is the GEX equivalent of the COT Index.
Z-Score
How many standard deviations is today's value from its 252-period mean? Beyond +2 or −2 is statistically rare and flags the most stretched positioning.
Moving Average Comparison
Is the spread, or the ratio, above or below its own 20-period average? A simple trend read on positioning rather than on price.
New Highs and New Lows
Is GEX at a 20-period high or low? Is it above both of the prior two readings? These catch positioning momentum, which often leads a volatility regime change.
GEX Signals in Build Alpha
Build Alpha includes gamma exposure data as a built-in signal source. Search "GEX" in the signal filter to find the available signals, usable as entries, exits, or strategy filters, no coding required. The 36 custom signals below extend that set and load alongside the built-in ones:

Custom GEX Signals: 36 Signals in 5 Families
Below is a set of 36 custom signals that turn the two GEX series into testable conditions. They are organized into five families. Every lookback and threshold (the $2.5B spread level, the 0.30 ratio, the 90th and 10th percentiles, the 20-period windows) is a parameter you can optimize in Build Alpha.
Spread_PositiveGEX is greater than GEX500, so GEX − GEX500 > 0.Spread_NegativeGEX is less than GEX500, so GEX − GEX500 < 0.AbsSpread_Above_2500MAbsolute difference between GEX and GEX500 exceeds $2.5B.AbsSpread_Below_2500MAbsolute difference between GEX and GEX500 is below $2.5B.
Spread_WideningGEX − GEX500 is larger than it was on the prior period, so the divergence is expanding.Spread_NarrowingGEX − GEX500 is smaller than it was on the prior period, so the divergence is contracting.Spread_Above_SMA20The GEX − GEX500 spread is above its 20-period moving average.Spread_Below_SMA20The GEX − GEX500 spread is at or below its 20-period moving average.GEXpct_Above_GEX500pctGEX's percentile rank is higher than GEX500's percentile rank, each measured over 252 periods.GEXpct_Below_GEX500pctGEX's percentile rank is lower than GEX500's percentile rank.
Ratio_Above_030GEX / GEX500 ratio is above 0.30.Ratio_Below_030GEX / GEX500 ratio is below 0.30.Ratio_Above_SMA20The GEX / GEX500 ratio is above its 20-period moving average.Ratio_Below_SMA20The GEX / GEX500 ratio is at or below its 20-period moving average.RatioPct_Above_90thThe GEX / GEX500 ratio is above its 90th percentile over 252 periods.RatioPct_Below_10thThe GEX / GEX500 ratio is at or below its 10th percentile over 252 periods.
GEX_Above_90thPercentileGEX is above its 90th percentile over the prior 252 periods.GEX_Below_10thPercentileGEX is at or below its 10th percentile over the prior 252 periods.GEX500_Above_90thPercentileGEX500 is above its 90th percentile over the prior 252 periods.GEX500_Below_10thPercentileGEX500 is at or below its 10th percentile over the prior 252 periods.SpreadPct_Above_90thThe GEX − GEX500 spread is above its 90th percentile over 252 periods.SpreadPct_Below_10thThe GEX − GEX500 spread is at or below its 10th percentile over 252 periods.Zscore_GEX_aboveGEX has a z-score greater than +2 over a 252-period window.Zscore_GEX_belowGEX has a z-score at or below −2 over a 252-period window.Zscore_GEX500_aboveGEX500 has a z-score greater than +2 over a 252-period window.Zscore_GEX500_belowGEX500 has a z-score at or below −2 over a 252-period window.Zscore_spread_aboveThe GEX − GEX500 spread is more than +2 standard deviations above its recent norm.Zscore_spread_belowThe GEX − GEX500 spread is at or below −2 standard deviations from its recent norm.
GEX_Above_Max_Prior2Current GEX is greater than both of the prior two GEX values.GEX_Below_Min_Prior2Current GEX is below both of the prior two GEX values.GEX500_Above_Max_Prior2Current GEX500 is greater than both of its prior two values.GEX500_Below_Min_Prior2Current GEX500 is below both of its prior two values.GEX_NewHigh_20GEX is at a new 20-period high.GEX_NewLow_20GEX is at a new 20-period low.GEX500_NewHigh_20GEX500 is at a new 20-period high.GEX500_NewLow_20GEX500 is at a new 20-period low.
CustomIndicators.xml, back into your BuildAlpha folder.GEX Trading Strategy Example
GEX describes the S&P 500 options market, but the signals are not limited to trading the S&P 500. Dealer gamma is a read on market-wide risk appetite and volatility, and that context carries into other assets. Here is a strategy Build Alpha generated automatically on Gold futures using GEX signals as entry conditions:

Any market or symbol in Build Alpha can use these signals. Equity indices are the obvious fit, but metals, bonds, currencies, and individual stocks all respond to the same swings in market-wide dealer positioning.
💡 Best Practice: GEX as Regime Filter, Not Trigger
The highest-value use of GEX is as a contextual filter. Let price signals generate the entry and let GEX decide whether the environment is right for it: breakouts only in negative gamma, fades only in positive gamma, or no new risk when the spread is at a 252-period extreme. Use Build Alpha's "required signal" setting to force a GEX condition before any entry fires, and pair it with market breadth or news event signals for even richer context.
Validate Before You Trust It
Thirty-six signals with adjustable thresholds is a large search space. Some combinations will look excellent by chance. Run the survivors through Build Alpha's robustness tests, especially the noise test and parameter permutation, before deploying anything built on GEX. No different than other strategy.
Takeaways
✓ Key Takeaways
- GEX measures dealer hedging pressure. Positive gamma dampens moves, negative gamma amplifies them
- On 2004 to 2026 ES data, the lowest GEX quintile out-ranges the highest nearly 3 to 1 the next day, and the effect holds in every sub-period
- Comparing two GEX series adds sign, size, change, and rank of the spread as separate signals
💡 Need to Know
- Raw GEX drifts over time. Normalize with percentile rank or z-score before comparing across years
- GEX works as a filter on price strategies and on any market, not only the S&P 500
- Build Alpha ships GEX data built in, plus the 36 custom signals above, no coding required
Gamma Exposure FAQ
Related Reading


David Bergstrom
A decade-plus in professional trading as a market maker and quantitative strategy developer at a high-frequency trading firm with a CME seat and consulting for CTAs and RIAs. Self-taught C++, C#, and Python programmer specializing in data science, machine learning, and trading strategy development.
What Traders Say About Build Alpha













Trade with Dealer Positioning Context
GEX data built in. 36 custom signals. Point-and-click strategies for any market. No coding required.