Free Friday #18 – Building a Strategy with Open Interest
What is Open Interest?
Open Interest is just the total number of outstanding contracts that are held by market participants at the end of each day. All derivatives have Open Interest. That is, both futures and options have their own Open Interest.
For example, the March SP500 e-mini futures contract can have its own Open Interest while the March 4000 Strike Call option can also have an its own Open Interest.
Open Interest is a proxy for cash flowing into the market. If Open Interest increases, then more money is moving into the market whereas Open Interest declining could be seen as cash leaving the market.
How is Open Interest Calculated?
Open Interest is calculated by adding all the contracts from opened trades and subtracting the contracts when a trade is closed.
For example, Steve, Chris, and Clay are trading the same futures contract. If Steve buys two contracts to open a long trade, open interest increases by two. Chris also longs four contracts, thus increasing open interest to six. If Clay puts on a short trade of three contracts, open interest again increases to a new total of nine.
Open Interest would remain at nine until any traders exit positions, which would cause a decline in open interest. If Steve sells both of his contracts and Chris exits two of his four contracts, then open interest would decrease by four from nine to five.
What is the difference between Open Interest and Volume?
Both are similar as they count total contracts traded. However, volume is a count of all traded contracts and open interest is a total of the contracts that remain open.
If a trader buys one contract, then both volume and open interest are one. If the trader sells the contract, then volume is two and open interest is zero. Volume is a running total of all transactions and Open Interest is the total of all open positions.
Is higher or lower Open Interest better?
Better is relative to your current market view or position. However, typically higher open interest is good because it signals more interest in a particular contract or strike price and may also signify that there is more available liquidity (i.e., exiting shall be easier and you may experience less slippage).
On the other hand, lower open interest may be a positive too. If the market moves or news comes out in favor of your existing position, then many traders may need to pile into your same trade pushing price in your direction.
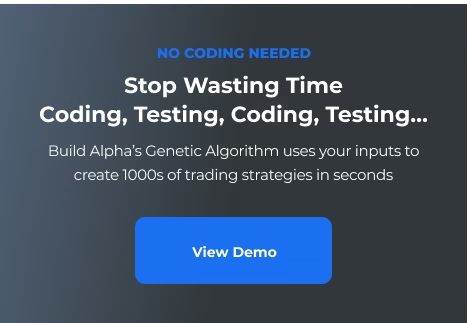
When in doubt, test your ideas on whether higher or lower Open Interest is better. That is what Build Alpha is for! Stay tuned for an example strategy later.
What is an Open Interest strategy?
A trading strategy that relies on Open Interest as an input signal or filter can be considered an Open Interest trading strategy. For example, if Open Interest rises by x% then buy or if Open Interest is greater than the N-day average, etc.
There are a ton of creative ways to incorporate Open Interest data into your algo trading strategy development process. Creativity is often a source of alpha!
Open Interest Trading Strategy Example
As always, happy Friday!
This week I was asked by a Build Alpha user if he could build strategies using a contract’s Open Interest. Open Interest is just the total number of outstanding contracts that are held by market participants at the end of each day. So, it is intuitive that as more contracts are opened or closed then it might be telling of how traders are positioning.
This is a detailed and advanced post. Build Alpha is all point and click, but this is certainly a way more advanced blog post showing how a more sophisticated user can utilize the software.
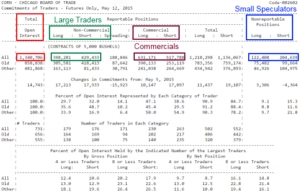
I have to admit this is not something I have looked at previously so I was quite intrigued, but I pulled some open interest data from TradeStation and saved it.
Structing Open Interest Data
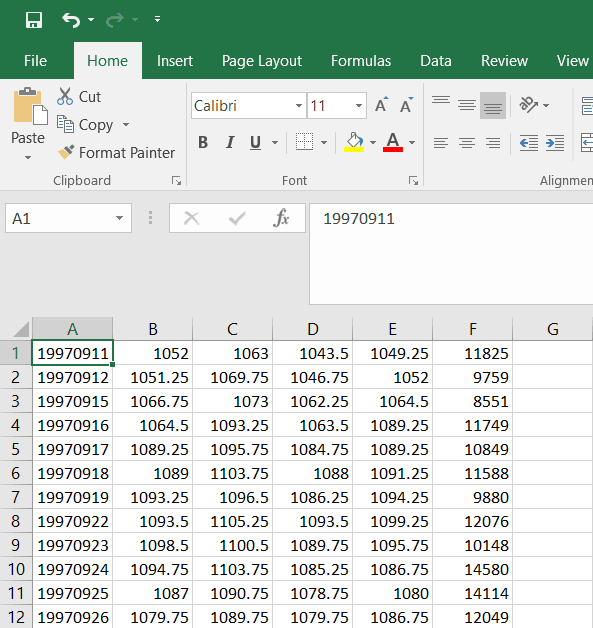
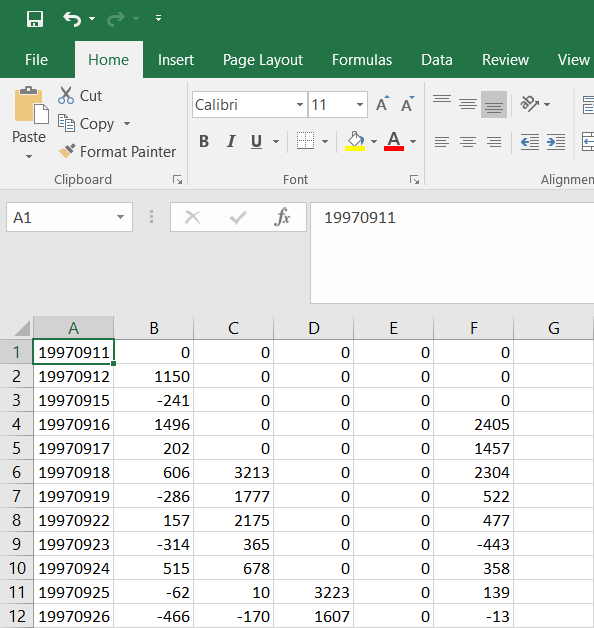
I then went on to create columns I – M below. Columns I-L are momentum measures (N period change) of Open Interest. For example, column J holds the Open Interest change over the past 5 days. Column K holds the Open Interest change over the past 10 days. Column N just holds the 3-bar sum of the 1-period momentum of Open Interest. The data can be seen below opened in Excel (I know who uses Excel anymore).

In order to use the above data in BuildAlpha, we need to format two separate files. First, we need to create a date, open, high, low, close, volume file of the actual S&P500 futures data (columns A, C, D, E, F, G). I copy and pasted those columns to a new sheet and then reformatted the date to YYYY/MM/DD, removed the headers, and saved it as a .csv file. Pictured below…
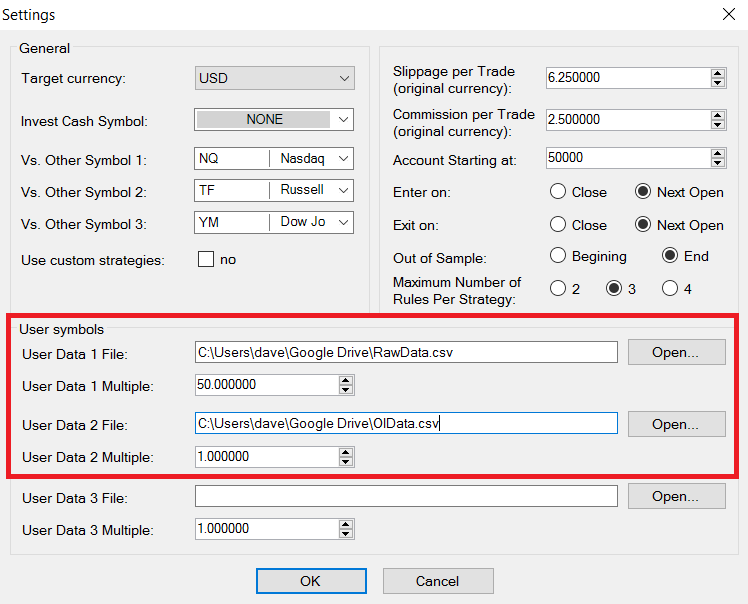
I then copy and pasted our dates and custom Open Interest data to a new excel sheet. This time instead of having the date, open, high, low, close, the volume we’ll use (copy) the date, 1-period OI change, 5-period OI change, 10-period OI change, 20-period OI change, 3 bar sum of OI as our six columns.
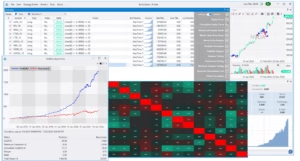
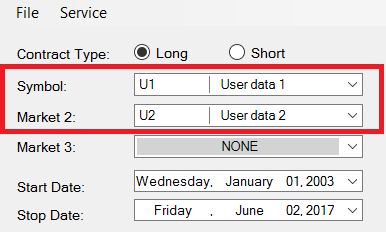
We can now pass this data into Build Alpha and build strategies using the Intermarket capabilities. However, in this case, our intermarket or Market 2 will be this custom open interest data and not some other asset.
Video Examples
The two videos below show exactly how I did this process in case you didn’t follow my Thursday night, two glasses of scotch deep, blog writing.
Build Alpha Open Interest Strategy Example
There is a different strategy displayed in the video above, but I promised some guys on twitter I’d share the strategy I posted Thursday. So below is the actual Free Friday #18. It holds for one day and trades when these conditions are true:
- Momentum(OpenInterest,20)[0] <= Momentum(OpenInterest,20)[5]
- Momentum(OpenInterest,20)[0] > Momentum(OpenInterest,5)[1]
- Momentum(OpenInterest,10)[0] > Momentum(OpenInterest,10)[1]

**S&P500 Futures strategy built on open interest data only and tested across Nasdaq, Dow Jones, and Russell Futures. Results just based on 1 contract**
So the last rule in Build Alpha would appear as Low2[0] > Low2[1] or translated as the low of Market 2 is greater than the low of Market 2 one bar ago. However, if you remember we created a custom data series for Market 2 and in the low column, we inserted the 10-period momentum of open interest!
Like I said this is a confusing post, but a really neat idea of how creative you can be with this software. The possibility of things we can test are immense.
Furthermore, when Build Alpha calculates RSI or Hurst, for example, using the close price of Market 2 (our intermarket selected) it will actually calculate RSI or Hurst on 20 bar momentum of the Open Interest (what we passed in for the close column)! You can also use the custom indicator/rule builder on these custom data columns.
You can also run strategies built on custom data like this through all the robustness and validation tests as well.
All in all, thanks for reading. I thought this was a cool idea taking system development to a whole new level.
Cheers,
Old Posts:
- Free Friday #17 – Would You Trade This?
- Free Friday #16 – Market Regime Switching
- Free Friday #15 – Download Data with Python
- Free Friday March 2017 Update
- Free Friday 14 and 14a – MultiMarket Portfolio
- Noise Test – Explained
- Free Friday 12 – Noise Test
- Free Friday February 2017 Update
- What is E-Ratio
- Free Friday 11 – Free Friday 11 – Sample Size
- Free Friday 10 – Sizing with Monte Carlo
- Free Friday 9 – Intermarket Signals
- Free Friday January 2017 Update
- Free Friday 8 – Randomized Monte Carlo