Free Friday #16 – Market Regime Switching Models
Happy Friday!
For this Free Friday edition I want to talk about market regimes or market filters. I have a very simple intermarket filter or regime monitor to share.
The idea with market regimes or filters is to identify a condition or set of conditions that alters the market’s characteristics or risk profile. Ideally, you could find a bull and bear regime that would enable you to go long when in the bull regime and get into cash or go short when in the bear regime.
The simple regime filter I want to share was found using Build Alpha’s Intermarket signals. It only uses one rule and creates a clear bullish and bearish regime.
The rule says that if the Close of Emini S&P500 divided by the Close of the US 10 Yr Notes is less than or equal to the 10 days simple moving average of the Emini S&P500 divided by the 10 days simple moving average of the US 10 Yr Notes then we are in the bull regime.
Here it is in pseudo-code assuming eMini S&p500 is market 1 and US 10 Yr Note is market 2.
Bull = Close1/Close2 <= SMA(Market1,10) / SMA(Market2,10)
Bear=Close1/Close2 > SMA(Market1,10) / SMA(Market2,10)
Let’s verify with some numbers that we have a discernible difference in market activity before I start flashing some charts at you.
Here are the S&P500’s descriptive statistics when in the bull regime:
- Average Daily Return: 1.20
- Std Dev Daily Return: 17.49
- Annualized Information Rate:
1.09
Here are the S&P500’s descriptive statistics when in the bear regime:
- Average Daily Return: -0.34
- Std Dev Daily Return: 12.11
- Annualized Information Rate:
-0.44
This would definitely qualify as something of interest. Let’s take a look at the equity curve going long when ES, the eMini S&P500 futures, enter into the bull regime.
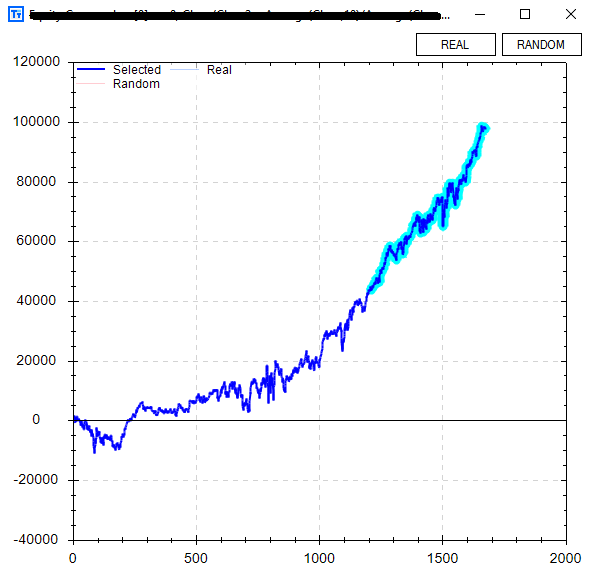
It actually performed quite well with no other rules or adjustments only trading 1 contract since early 2002. It even looks to have started to go parabolic in the out of sample data (last 30% highlighted).
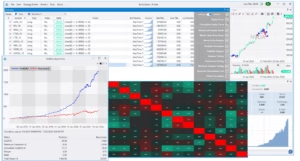
Build Alpha now offers another check for validity -> The ability to test strategy rules across other markets. This is very important when determining how well a rule generalizes to new (and different) data. The user can select whatever markets to compare against, but in the example below I chose the other US equity index futures contracts. You can see Nasdaq futures in gold, Russell Futures in green, and Dow Jones futures in red.

Now back to our Free Friday regime filter… Wouldn’t it be cool if the US 10 Yr Note performed well while Emini S&P500 was in the bear regime? That way instead of divesting from the S&P500 and going into cash we could invest in US 10 Yr Notes until our bull regime returned.
Well, guess what… the US 10 Yr Note Futures do perform better in the bear regime we’ve identified.
The best part is… Build Alpha now lets you test market regime switching strategies.
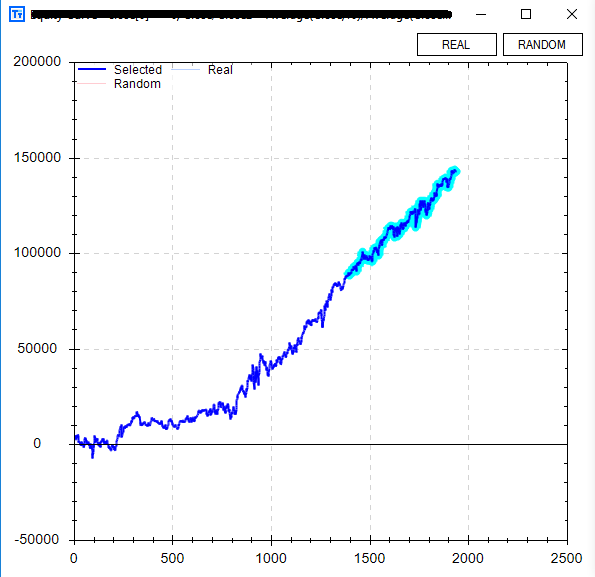
That is, invest in one market when the regime is good and invest in another market when the regime changes. This ability smoothed our overall equity curve and increased the profit by about 50%! Below is an equity curve going long Emini S&P500 in the bull regime and going long US 10 Yr Note Futures when the regime turns bearish.
Some major new additions coming to Build Alpha and I’ll be announcing them soon. As always thanks for taking the time to read these.
Happy Friday,
Dave
Old Posts:
- Free Friday #15 – Download Data with Python
- Free Friday March 2017 Update
- Free Friday 14 and 14a – MultiMarket Portfolio
- Noise Test – Explained
- Free Friday 12 – Noise Test
- Free Friday February 2017 Update
- What is E-Ratio
- Free Friday 11 – Free Friday 11 – Sample Size
- Free Friday 10 – Sizing with Monte Carlo
- Free Friday 9 – Intermarket Signals
- Free Friday January 2017 Update
- Free Friday 8 – Randomized Monte Carlo
Thanks for reading,
Dave