The Commitment of Traders Report is a weekly report released by the Commodity Futures Trading Commission (CFTC) that shows the open interest for futures and options on futures in markets with 20 or more traders holding positions above or equal to the reporting levels established by the CFTC. The report shows open interest data as of Tuesday but is not released until Friday afternoon.

The reports are based on open interest position data supplied by reporting firms such as FCMs, clearing members, foreign brokers and exchanges. The data is categorized by the trader’s dominant business purpose self-reported by traders on the CFTC Form 40 and is subject to review by the CFTC.

The report is broken down into three different types of traders:

  • Commercial traders (hedgers): Traders in this category are typically considered to be market professionals, such as producers, processors, users, merchants, and swap dealers. These traders use futures markets to hedge against price changes in the underlying commodities. They are considered to have a direct commercial interest in the underlying commodities.

  • Non-commercial traders (large speculators): This category of traders is considered to consist of speculators who trade futures contracts for financial purposes, rather than to hedge against price changes in the underlying commodities. These traders include hedge funds, Commodity Trading Advisors (CTAs), individual traders, and other investment firms.

  • Nonreportable (small traders): These traders are defined as those holding positions below the reporting levels established by the CFTC. Traders in this category are considered to have less impact on the market and provide valuable insight into market sentiment and behavior. Their positions are classified as non-reportable positions in the COT report.

Smart Money vs Dumb Money

The COT report is broken down into three categories of traders and often the commercial traders and to a lesser extent the non-commercial traders (large speculators) are considered “smart money”. The nonreportable category is often called small speculators or retail traders which unfortunately gets the moniker “dumb money”.

CFTC COT Report for futures market

Watching the divergence between smart and dumb money can often leave clues to direction or market sentiment which can help influence trading approaches. The most popular COT trading style is watching when these two categories diverge to extremes as large divergences between smart and dumb money is typically when or how the market moves. Someone has to be someone’s liquidity!

Is there Free COT Data?

Yes, COT data is freely available on the CFTC’s website at cftc.gov and then navigating to the Commitment of Traders report link here: Commitments of Traders | CFTC

However, the historical data from COT reports are not formatted for easy use and often needs modification to make useful futures markets signals. More on how Build Alpha does this later.

How can traders use COT data?

Simply using the commitments of traders reported data as a trade signal is not a great idea! The data is shared as long and short positions and is not normalized for Tuesday’s open interest. Instead, the values are just raw values and rather meaningless on their own. For instance, is a number of 10,374 contracts long a lot or a little? Well, it depends on what open interest is! And how many contracts are short!

There are two simple ways of deriving signals from COT data. First, the normalized net position which is expressed as a percent. Positive 20% would mean the net position is long and 20% of open interest. The second way is the COT Index.

What is the COT Index?

The COT Index or Commitment of Traders (COT) Index is a popular trading indicator showing where current net positioning is in relation to historical positioning of the same trader group over the past three years (36 months).

A COT Index reading of 100 means the group is the most bullish compared to any point in the past 36 months and a reading of 0 means the group is the most bearish compared to any point in the past 36 months. The COT Index can be calculated on Commercials, Non-Commercials, or Non-Reporting traders.

Above is an image showing the SP500 price fluctuations with the non-commercial trader (large speculators) positioning via COT Index over the past 36 months. Traders can isolate periods of extreme positioning to identify the start or end of a trending environment.

In Build Alpha, traders can test any COT Index value or range of values from the point-and-click interface. Here’s a sample strategy that goes long $10,000 per trade in QQQ (Nasdaq ETF) when Nasdaq futures non-commercials COT Index is less than or equal to 50. Simply being long QQQ when large speculators are less bullish (blue line) has drastically outperformed QQQ buy and hold (red line) over the past 20 years.

This signal can of course be improved by requiring this signal and having Build Alpha search thousands of other signals to find complimentary filters.

Simpler COT Trading Signals

The simplest COT trading signal is to look at the net position – subtract the shorts from the longs – so that a positive number means that particular category of trader is net long and a negative number means that category of trader is net short. If the net position is zero, long and short traders’ positions reported equal each other. It is common when there is no underlying bias or directional sentiment that traders hold positions equal to each other or close to it.

Further, we can then divide the net number by the total open interest to express a normalized value that can provide apples to apples comparisons over time or across markets. A value of -0.20 would be a 20% net position or 20% of open interest is positioned short.

COT Report Commercial Traders vs Non Commercial Traders

COT Report Trading Signals in Build Alpha

Build Alpha has COT data back to 2000 included in the 5,000+ built-in signal library. You can search for them in the top filter using “COT” as pictured below.

Commitment of Traders Report Trading Signals in Build Alpha

These signals can be used for entries, exits or general strategy filters. Build Alpha has COT data for the following markets:

  • S&P500

  • Nasdaq

  • Dow Jones

  • Vix Futures

  • AUDUSD

  • USDCAD

  • Dollar Index

  • EURUSD

  • 2-Year Note Interest Rates

  • 5-Year Note Interest Rates

  • 10-Year Note Interest Rates

  • 30-Year Bond Interest Rates

  • Natural Gas

  • WTI Oil

  • Silver

COT Report Trading Strategy Example

Index traders take a look at this one! This simple SP500 futures market strategy demonstration was built using Build Alpha’s COT signals. I only used the COT signals and did not use any other price, volume or non-price based entry or exit signals. This strategy enters whenever the following is true:

  • Nasdaq Commercials Net positioning is 15% or less of open interest

  • Five-Year Note Commercials Net positioning is 15% or less of open interest

  • AUDUSD Commercials Net positioning is 10% or less of open interest

The strategy simply exits after one bar. Its performance below is from 2007 through 2023 using only one contract per trade.

Financial Futures Reports COT Trading Strategy

COT Indicator or Filter

A better use of non-price data like COT report or other sentiment data is often to use the data as a filter to a price action or price and volume-based strategy. Price strategies often lack context about the market environment and as we all know patterns and signals act differently in different market conditions.

COT data and other non-price based data acts as a way to relay information about the environment to our trading systems.

Below is a simple example of how to find or improve a simple price action strategy with COT report data as a filter using the required signal functionality in Build Alpha.

Cool Ideas for using COT Data with BA

You can pair COT data with economic news events. For instance, perhaps it is only worth trading a news event when smart money is in the same direction. Perhaps intraday trading systems could benefit from a filter from larger players.

Summary

The Commitment of Traders COT Report is a weekly report released by the Commodity Futures Trading Commission which discloses open interest and market positioning in futures markets and options on futures markets for three different types of traders: Commercials (hedgers), non-commercials (large speculators), and nonreportable speculative traders (small trader).

The data gives insights into how market participants are positioning for future trends and give an asset manager or commercial traders an idea on market timing or pending market pressure. The report is released Friday but only contains data up until Tuesday.

Traders reports and other non-price-based data can be valuable contextual information to relay market environment or regime details to automated trading strategies. Build Alpha now contains COT report data for 15+ futures markets that can be used to create automated trading strategies without any coding.

Author

David Bergstrom – the guy behind Build Alpha. I have spent a decade-plus in the professional trading world working as a market maker and quantitative strategy developer at a high frequency trading firm with a Chicago Mercantile Exchange (CME) seat, consulting for Hedge Funds, Commodity Trading Advisors (CTAs), Family Offices and Registered Investment Advisors (RIAs). I am a self-taught programmer utilizing C++, C# and python with a statistics background specializing in data science, machine learning and trading strategy development. I have been featured on Chatwithtraders.com, Bettersystemtrader.com, Desiretotrade.com, Quantocracy, Traderlife.com, Seeitmarket.com, Benzinga, TradeStation, NinjaTrader and more. Most of my experience has led me to a series of repeatable processes to find, create, test and implement algorithmic trading ideas in a robust manner. Build Alpha is the culmination of this process from start to finish. Please reach out to me directly at any time.

What’s New in the Build Alpha Update

First, thank you all for the patience on this update. A lot has happened since the last update. Covid lockdowns, I built and sold another software company (now part of a public company), had two kids (being a dad is the coolest), consulted for a handful of funds, partnerships with TradeStation, Interactive Brokers, etc.

Long story short, I’m focused on Build Alpha and have a lot to share!

Here is a brief table of context of what is new in this update:

  • Live Data monitoring
  • Historical intraday database
  • Data Converter No Code
  • Automated Workflows
  • New Code Generators (Pine, IB, MT5)
  • Cryptocurrency Data
  • *Beta* Intelligence Report
  • Quantified Chart Patterns
  • Vs Shifted Test
  • Monte Carlo Permutation Test
  • Ability to train systems on synthetic data
  • Tonight Mode
  • Quick Test
  • Updated Custom Signal Builder
  • Machine Generated Rules
  • Signal Pools
  • OR Logic Exits
  • Conditional Signals
  • Dark Mode Option
  • Drawdown Normalization
  • Fixed Fractional Position Sizing
  • Position Sizing Scalers / Continuous Signals
  • Commitment of Traders Data
  • Weather Data
  • Market Breadth Data
  • Google Trends Data
  • Parameter Permutation Testing
  • Stress Testing or Scenario Testing
  • Walk Forward with Synthetic Data
  • Opening Range and Custom Entries
  • Custom Fitness and Correlation
  • Multi-strategy Portfolio Simulation
  • Portfolio Suggest
  • Daily Position Report

Live Data Monitoring

Build Alpha now connects to live data feeds for strategy monitoring and alerting real-time positions. This gives a much more reliable way to track hundreds of strategies than exporting code to your respective broker platform. Note: You can still export code for any strategy!

Build Alpha live data view

Historical Intraday Database

Build Alpha now has a historical database going back to 2006. The API connections are great for live data updating; however, the APIs do not always quickly provide historical data for testing and often fail with many consecutive API calls (or randomly).

Build Alpha can still use built-in data files, imported data files, API connections, and now the built-in historical intraday database. You can easily access built-in intraday data via the Server-side symbols dropdowns.

Build Alpha built-in historical intraday database

No Code Data Converter

Import any data file from any source with any format and Build Alpha will format it. No more converting or formatting with excel, python or ChatGPT. Includes the ability to resample (create) any higher timeframe as well.

Automated Workflows

Traders can now set in-sample, out-of-sample and combined results filters to automatically discard any strategies not meeting certain criteria. Traders can set performance metric thresholds to ensure strategies have a high enough winning percentage, high enough profit factor, trade frequently enough, etc. 

Additionally, set advanced filters and automate robustness testing! For example, traders can specify the lower band of the Noise Test to be positive or the 90th percentile of the Variance Test to be x% of the backtest or various other ideas.

This makes finding strategies that fit your portfolio or risk criteria even simpler. Run a simulation and only see what passes your filters and tests.

Build Alpha Automated Workflows

This really makes it possible for lazy or busy people to develop exactly the algorithmic trading strategies they’re after in financial markets.

New Code Generators Added (TradingView, Interactive Brokers and Metatrader5) and Improved

Build Alpha now generates fully automate-able, trade-able code for any strategy it builds for TradingView (Pine Script), Interactive Brokers (Python) and MetaTrader5.

New Code Generators in Build Alpha

This adds to the existing list which now looks like

Build Alpha code generators buttons

Read more on how and what TradingView Pine Script is and how it works with Build Alpha. You have full control over any generated code or trading algorithms. Image below shows TradingView (left), Build Alpha (center), TradeStation (right) displaying the same equity curve.

Additionally, I’ve revamped the Ninjatrader8 generated code. NT8 has grown in popularity as it appears to be the backend or broker of choice for many prop firms and prop challenges. Build Alpha (left) fully supports NT8 (right).

Cryptocurrency Data and Connectivity

You can now connect to Binance or use the historical database to build cryptocurrency strategies with no code. Binance connection will permit live position updating of any saved crypto strategies.

Build Alpha also supports fractional sizing so you can buy pieces of coins for accurate backtesting results and flexible position sizing options. Please suggest what other crypto connections I should add. Note: You do NOT need any of these connections to use Build Alpha.

Build Alpha broker connections menu options

Intelligence Report

Build Alpha can now review all your saved strategies and make suggestions to automatically help improve them. This is new [beta] AI feature has been trained on thousands of strategies and market environments. Anyways, you can run the Intelligence Report from the Brokers menu and any strategies with an IR icon have a suggested improvement. Click on the IR icon to view the suggested modification.

This has made strategy modification and improvement much simpler!

Quantified Chart Patterns

One of the largest requests from new traders (and some professional traders) is to test [infamous] chart patterns. To do so properly, the patterns must be quantified. That is finally possible in Build Alpha. The chart patterns Build Alpha now supports are:

  • Double Top and Double Bottom

  • Rising Wedge and Falling Wedge

  • Broadening Top and Broadening Bottom

  • Bull Pennant and Bear Pennant

  • Ascending and Descending Triangle

  • Bull Flag and Bear Flag

  • Head and Shoulders and Inverse H&S

Here is a quick example on $DIA ETF and how to select them as entry or exit signals in Build Alpha for testing

Build Alpha Automated Chart Patterns Example
Build Alpha Strategy Builder Chart Pattern Signals

Vs Shifted Test

Every data provider uses hourly bars from the top of the hour to the end of the hour. That is, 11:00 to 12:00, 12:00 to 13:00, etc. However, shifting the opening and closing time can create additional data sets with near identical properties.

“Shifted Data” is a great way to evaluate if our strategies require the exact historical data patterns for success or will be robust to slight variations (spoiler there will be variations in live trading).

Shifting the data works on any timeframe. This test may change bar patterns, high and lows, consecutive up and down streaks, indicator calculations, and more.

Here is an example from my Complete Robustness Testing Guide, assume a long strategy needs four consecutive red bars to trigger a trade. In the original data (on the left), the strategy nailed a winner. On the shifted data (on the right), the trade never happened.

OHLC Charts with Time Shifted Data

Re-trading your strategy on shifted data can give insights on how overfit your strategy was to the EXACT patterns available in the historical price data. Past performance should maintain across shifted data sets. If performance degrades, it may be a warning sign that the strategy is overoptimized (overfit). Here is one example of the Vs Shifted output

Build Alpha Vs Shifted Test Results

Monte Carlo Permutation Test

The MC permutation test is a unique approach to randomizing the underlying OHLC data originally presented by Timothy Masters in his book Permutation and Randomization Tests for Trading System Development (Masters, 2020).

The Monte Carlo Permutation test takes the logs of interbar gaps and the intrabar OHLC relationships, randomizes their order, then exponentiates them back into raw OHLC prices. This process creates unique OHLC data while destroying any underlying patterns.

This newly created data, like other adjusted data sets Build Alpha creates, can provide another test set of data to make sure our data was not overfit to the actual historical data. I love multi-path tests like this! Another stress test for the arsenal.

Monte Carlo Permutation Test Results in BA

I discuss interpretations and Tim’s views in my full Monte Carlo Trading Guide.

Build trading systems on synthetic data

Testing trading strategies on synthetic or altered data such as Noise-adjusted data, Vs shifted data, Monte Carlo Permuted data, etc. post simulation is a great way to identify curve fit or overfit strategies before trading them live.

However, can we use this altered data pre-simulation to build more robust trading strategies? This new feature in Build Alpha allows you to add altered data series to the genetic algorithm (simulator engine).

Add synthetic data to Build Alpha Strategy Builder

You can think of these altered data sets as alternate universes from a multiverse. The actual historical data we lived through is our universe, but these other universes were a possibility that we could have lived through. Since we don’t know what will happen next, we need a strategy that is robust across the multiverse!

Below is our universe in the upper left and three alternate universes. You can see each universe made all-time-highs at a different time and each took different paths (despite all ending at the same point).

Build Alpha Synthetic Data for Trading System Development

Build Alpha will return the results of the strategies that perform best across the basket (or multiverse) and you can breakdown and view each universe’s specific performance. The ‘MCP’ suffix denotes the underlying data for this strategy was generated via Monte Carlo Permutation.

Build Alpha Monte Carlo Permutation Synthetic Data Results Window

Read this full guide on how to build strategies on synthetic data

Tonight Mode

This feature automatically selects all entry signals that are true for the given day. Select the symbol and date, then hit the ‘Positive’ button and Build Alpha will auto-select every true signal. Very cool feature to find things for the coming day, week, etc. It also helps those who have trouble coming up with trading ideas.

BA Tonight Mode Feature

Quick Test

A quick and dirty way to get high level insights into a trading strategy. This enables traders to configure their entry, exits, stops, targets, symbol universe and hit ‘Quick Test’.

The Quick Test will provide a breakdown including:

  • Summary of results

  • Top Tickers

  • Worst Tickers

  • When stops are hit

  • When profits are hit

  • When breaks pre-market high

  • When breaks pre-market low

  • When makes high of day

  • When makes low of day

One beta user described this as “an incredible weapon” to investigate and extract more edge from a trading system. For forex, futures and crypto it will check 24 hours.

Build Alpha Quick Test Feature

Updated Custom Signal Builder

My goal, as stated on the BA homepage, is to bridge the quantitative trading world with those who cannot (or do not want to) code. This means adding more flexibility and functionality to Build Alpha.

The latest version has an improved Custom Indicator Builder so you can build your own signals and add them to the existing 5,000+ BA signal library.

Build Alpha Custom Signal Editor Interface

I wrote all about this new feature in its own post. The Custom Signal Builder post has examples and a how-to-use walkthrough! I also wrote this about Feature Engineering Trading Signals (building custom signals).

Parametric Custom Signals

All custom signals are also parametric so you can optimize them through the Build Alpha interface. This goes for signals created using the no code editor (above) or custom signals added via python.

Parametric Custom Signals in Build Alpha

Machine Generated Rules

You can enable or disable this feature in the Additional Settings menu. If enabled, Build Alpha will use your selected signals to create new signals. Typically, Build Alpha will look at things like counting, sequence, correlation, weights, decay and various other transformations to create new signals from your existing selected signals. Disable this feature and Build Alpha will only use signals you have selected.

Machine Generated Rules - Build Alpha

You can read more in this Feature Engineering blog post.

Signal Pools

A Signal Pool or Trading Signal Pool is an aggregation of other signals to determine how many signals occur on the same bar. Looking at the combination of trading signals or pooling signals together can often present more insights and breadth of the current market.

Consider three signals like

  1. Close is above SMA200

  2. 2-period RSI is below 10

  3. Bearish Engulfing candle

On any given bar we could have 0% true, 33% true, 67% true or 100% true. Below is a plot for 10 different RSI signals on the SP500 Emini Futures.

BuildAlpha Signal Pool Display

You can create Signal Pools with the Custom Indicator Editor. Read more about creating custom Trading Signal Pools and how they can improve simple or weak trading signals and technical indicators.

This is also how to create OR entry rules. That is, the Signal Pool is > 0 means at least one of the pooled entries is true.

OR Exit Logic

Combine exit signals with OR logic. Nothing major just an additional Exit Signal Mode for more flexibility.

Conditional Signals

Trading rules don’t have to be rigid. For example, a volatility-based exit could tighten when markets get choppy or loosen as a trend strengthens. With Build Alpha, you can create conditional signals: if condition is true, use exit1; if false, use exit2. These conditions can also be combined and nested for more nuance than a simple on/off rule.

Example:

  • If VIX > 25, exit if price falls below a moving average.
  • If VIX < 25, exit if price drops 3 ATR below the highest close of the past N bars.

In low volatility (VIX < 25), dipping below a moving average might not matter, but when volatility spikes (VIX > 25) and price breaks below, it could signal trend reversal — so exiting makes sense.

Custom Signal Editor Conditional Signal in Build Alpha

This flexibility lets you adapt exits to different market regimes, test assumptions, and even redefine concepts like “overbought” based on context — all within Build Alpha.

Parametric Python Signals

First, I must reiterate, Build Alpha does not require you to write any python code. Build Alpha is completely no code! However, if you want to extend Build Alpha with your own custom signals you can use the no code editor or you can add custom python signals.

Now you can add python signals that can be parameterized and optimized by Build Alpha! Simply place your variables inside one comment section of the python template and then control the parameter ranges from Build Alpha’s user interface.

You can read more about extending Build Alpha with python in this blog post.

Dark Mode Option

You guys asked and I could no longer deny it. For those of you burning the midnight oil, there is finally dark mode available for Build Alpha. You can control color option from the main menu View >> Themes >> Light or Dark. Here’s a quick snapshot of Build Alpha in dark mode.

Build Alpha Dark Mode Image 1
Build Alpha Dark Mode Image 2

Drawdown Normalization

The latest version has a new feature in the Individual Equity Curve graph called “DD Norm” short for Drawdown Normalization. This feature aims to show how a strategy would perform (hypothetically) if one were to scale the sizing of the strategy so that the strategy’s drawdown would match the drawdown of Buy and Hold. In other words, how the strategy would do assuming the same “risk” as Buy and Hold.

BuildAlpha Drawdown Normalization or DD Norm

Fixed Fractional Position Sizing

Size your trades based on distance to stop loss or risk level. This was popularized by (the late) Dr. Van Tharp. This is a new position sizing method added to the existing list of fixed dollar sizing, volatility based sizing, etc.

Position Sizing Scaler / Continuous Signals

Create continuous signals to multiply your position size. Some refer to this as “signal strength” but I feel that is too limiting in its application. Anyways, this feature enables total flexibility to create position sizes that scale with any market condition or calculation.

For instance, perhaps trading more [size] when volatility or volume spikes is helpful (and perhaps it is the other way); however, not testing how to size during different market conditions is the only real mistake. Build Alpha now has a no-code editor (and python ability) to create these custom or continuous sizing rules pictured below.

Plot any position sizing scaler to review it before adding to a simulation.

Notice the subplot shows position size grows as price declines from normal. You can also create the inverse, normalize, standardize, use percentiles, etc. to create flexible position sizing rules.

Additionally, you can create rules and allow Build Alpha to show you how any strategy would perform with any position sizing scaler. If position sizing scaler is enabled, the scaler logic will be added to the generated code for any and all platforms automatically. Below shows how different position sizing scalers can affect total P&L by 50%+ in some cases. Always worth exploring.

Position Sizing Scaler Display Equity Curves BuildAlpha

Commitment of Traders Report Data Added

Crowded trades and understanding positioning are playing a larger and larger role in today’s market. The Commitment of Traders Report is published by the CFTC and contains information how hedge funds, commercial hedgers and retail traders are positioning. This can help you understand if you are positioning with smart money or the dumb money.

COT Signals in Build Alpha

This data can provide context about market environment for price and volume-based strategies. Build Alpha now has COT Report data included. You can read more about it here and see an example strategy using a COT filter: Improving Strategies with the Commitment of Traders Report

Weather Data Added

Build Alpha now has weather data going back 30 years to test and build trading strategies. Weather data has been successful in helping large tier 1 trading firms generate alpha over the past few years and is now available.

Weather Signals in Build Alpha Editor

For instance, Citadel – the world’s most successful hedge fund – generates more from commodities than any other strategy – $30b+ since 2002. However, half of that gain has come in the last four years under Sebastian Barrack. Barrack grew a tiny strategy to one that generates 50%+ of their profit some years by using weather models (and physical tracking).

The Financial Times has a great piece on Citadel’s use of weather data here: How Citadel harnessed the weather to claim hedge fund crown.

Citadel Headline using Weather Data

Read more about Build Alpha weather data for trading here.

Market Breadth Data Added

I have expanded the data in the existing Market Breadth Signal category. There is now AAII, NAAIM sentiment data. You can read about all the market breadth, sentiment and other alternative data Build Alpha has included here: Improving Strategies with Market Breadth

Google Trends Data Added

Build Alpha now has Google Trends data so traders can add sentiment and search history volume to simulations. Build Alpha has Google Trends data for the following keywords for the last 20 years (note Google already normalizes this data)

Google Trends Signals in Build Alpha
  • Recession
  • Bear Market
  • Market Crash
  • Market Bottom
  • Buy Gold
  • Financial Crisis
  • Bank Failures
  • Open a trading account
  • Best stocks to buy
  • Day trading
  • Options trading
  • Unemployment benefits
  • Mortgage rates
  • Inflation
  • Interest Rates
Google Trends screenshot for Market Crash search term

Parameter Permutation Test

Build Alpha always let you test and optimize parameters; however, I have recently added a simple Parameter Permutation Test to the right-hand panel for a quick view. Hit this button and quickly view how a strategy performs with +/- X% variation to all parameters used in the strategy with default being 10% fluctuation.

Varying the parameters also helps better set expectations. Your strategy may return 5x but after optimizing the strategy it is better to expect 2-3x (arbitrary example).

Also, a wider dispersion of results is often a sign of overfitting and of course seeing large performance degradation is a more overt sign of overfitting. Here’s an example of desirable results that are closely knit:

To read more about Build Alpha’s advanced optimization and sensitivity feature please check out this post: Optimizing across noise adjusted data sets for more robust parameters

Stress Testing or Scenario Testing on Synthetic Data

Stress-test your strategy against the market you fear—before it happens. Build Alpha generates synthetic price series that match the statistical “fingerprint” of any asset or regime you select, then automatically tests your strategy across them. Build Alpha supports two data generation engines and a no-code rule builder to make setup fast. Chain rules with OR and BA evaluates each rule independently—color-coding results—so you can see, at a glance, how your system holds up to multiple hypothetical stressors on a single chart.

Stress Testing Trading Strategies Build Alpha

Build Alpha will also generate summary statistics – displayed under the chart – showing how each rule performed. These insights can reveal which scenarios cause trouble or spark new ideas for hedging strategies.

Stress Test Chart Display Build Alpha

Walk Forward Testing (with and without Synthetic Data)

Walk Forward Testing splits the historical data into multiple training and testing partitions where we optimize strategy parameters during the training data (in-sample data, blue below) and test the best parameter settings on the unseen (out-of-sample, green below) data.

The Walk Forward test button has been added to the right-hand panel of the Strategy Generation results window. You can run various out of sample splits, runs, and create your own pass/fail metrics. Additionally, you can add alternative (synthetic) data to optimize across not only the historical price data but also on synthetic, noise adjusted data. This allows us to test our strategy on alternate realities other than the single one we lived in!

You can read more about Walk Forward Testing at this blog post.

Opening Range and Breakout Entries

Change entry type to stop or limit orders and specify logic. Full flexibility to create custom entry logic including opening range breakouts (e.g., buy the first n-minute high of the day). Below shows how to enter at 0.50 ATR above the high of the (traditional) opening range (9:30 AM EST to 10:30 AM EST). To enter at the exact high of the opening range please make the Entry Adjustment Value 0.

You can pair this with a time signal to only trade between 10:30 AM and 4:00 PM. Additionally, you can set a maximum number of trades per day and even force an exit at the end of the day to have no overnight risk. It is extremely simple to have Build Alpha generate traditional intraday breakout strategies now.

The strategy example above uses the first two 30-minute candles of the regular trading session (9:30 – 10:30 AM, volume spikes) as the opening range and buys the breakout at the opening range high. The trade then closes at the end of the day (last big volume spike of the day, 4:00 PM) for no overnight risk.

Import and Export Strategies

Build Alpha also allows you to highlight (ctrl + click) and then go to File >> Export to export strategies. These can be sent to any other Build Alpha user for easier collaboration. The receiving end can go to File >> Import and the strategies will be appended (added) to their portfolio. You can right-click to re-run or modify on your own.

Import and Export Strategies in Build Alpha

Probability of Profit Models (beta)

You can now create Probability of Profit models to overlay on your automated trading strategies. These models will predict the probability that your next trade is profitable. You can create these machine learning models with a new, no code editor and view the individual decision trees. Here is an example decision tree below.

The trader can now view a Probability of Profit model as soon as a new trade is initiated in Build Alpha’s live data view. You can see below the demonstration model shows a 60.39% chance of this current trade resulting in a profit in “Prob Profit” column.

To read more about Probability of Profit models please check this full blog post.

Social Posting (beta)

Right-click on any saved strategy to enable automatic social posting when a new trade is entered. You can publish to x.com or discord. Instructions to set it up are in the written User Guide.

You can publish any trading system

  • with or without entry and exit logic visible
  • after x number of wins or losses
  • add your own text or logo

You can configure all of this through this easy to use interface seen below.

Custom Fitness and Correlation Fitness

Build Alpha now has the ability to search for strategies that meet any custom fitness function. This is the metric that the software will optimize for. Instead of optimizing for Sharpe ratio or total return now you can create a weighted fitness function that combines many metrics.

Custom Fitness Editor Build Alpha

Additionally, you can now set Correlation as the fitness function and Build Alpha will search for strategies that are the least correlated to your existing portfolio. This is a huge time saver to find complimentary strategies that can improve risk-adjusted returns.

Portfolio Mode

Build Alpha now lets you combine many independent, uncorrelated strategies into one shared account, simulating realistic capital interactions (not just merged trade lists), and optimize rebalancing, sizing, and exits for the whole portfolio. Full multi-strategy portfolio simulations!

Build Alpha Multi-Portfolio Portfolio Mode

Test filters and ranks at scale, inspect correlations, run multi-strategy Walk Forward, stress test across synthetic regimes, and even tap Portfolio Suggest (AI) to discover allocations and rules that improve risk-adjusted returns finding the best combinations and weightings of all your saved strategies.

Portfolio suggest gif

Includes fundamental data (Nasdaq) for factor models and symbol filtering, in-trade re-sizing to target volatility, and a Daily Position Update Report for pre-open workflow. A full multi-strategy testing and monitoring environment. Read more here: Build Alpha Portfolio Backtesting

Build Alpha Multi-strategy Portfolio backtesting

Summary

If you are starting to look at algorithmic trading, beginning as an automated trader or a serious trading system developer then this new update has something for you. I always want to remind everyone that the BA license does come with instructional videos, a written user guide and support. I am literally always in front of a computer because I love this stuff; contact me through the website or email anytime. I will keep building this algorithmic trading software and appreciate all of those that continue to make suggestions, test features, be sound boards, etc. because without the BA community this just wouldn’t be possible (or fun). What should I add next?

BA Customer Support Love
BA Product Love

TradingView Pine Script is a proprietary programming language developed by TradingView to allow traders to easily create custom indicators, signals, and strategies to be used with TradingView’s charts and website.

TradingView and Pine Script

In this blog, I will cover the basics of Pine Script, a few simple examples, and how traders can leverage Build Alpha (no code software) to create their own Pine Script indicators and strategies.

Why should I use Pine Script?

Pine script is a simple to use scripting language geared towards traders with little to no programming experience. Traders must have an edge to compete in the markets and I am a staunch believer that edge must be quantified! If you cannot quantify your edge, then you simply do not have one.

Pine Script programming gives traders a simple way to code their ideas and see if an edge exists. Whether analyzing your own indicators or creating strategies for backtesting or something more advanced like Edge Ratio, traders must calculate their edge before live trading.

Pine Script is a good middle ground for a trader or analyst who wants to do some coding but does not want to learn a real programming language such as C++ or Python (or has not heard of Build Alpha), for example.


Resources to learn Pine Script

For those of you interested in learning Pine Script, the TradingView documentation is pretty good. I would recommend starting here: Pine Script™ v5 User Manual — Pine Script™ v5 User Manual v5 documentation (tradingview.com)

Please note these guys update Pine often so there are ever evolving changes, but it has seemed to stabilize over the past few releases.

Can Build Alpha generate Pine Scrit?

Yes. Build Alpha can generate TradingView Pine Script strategy code from its no-code strategy builder. You can paste the code directly into TradingView’s Pine Editor to visualize and trade the strategy. More below.

Pine Script Vs. Easy Language

Much like Pine Script, Easy Language is TradeStation’s proprietary programming language geared toward helping traders with no coding background put their indicators and strategies into code for proper testing.

TradeStation’s Easy Language is more than two decades old and very popular among systematic traders looking to automate trading logic. To read more: The Best Way to Properly Backtest on TradeStation (buildalpha.com)

Both programming languages come with many built-in keywords and functions for trading such as technical indicators, order management, and more making testing strategies and coding multiple indicators easier.

As of now, TradeStation’s Easy Language is more robust than Pine Script and the consensus favorite platform among Build Alpha traders. However, Pinescript programming is slowly catching up in terms of backtesting functionality and flexibility but not quite as full functioned yet (more examples later).


Code Comparison

On the left-hand side we have a custom indicator for the moving average function in Easy Language and on the right-hand side there is custom pine script to plot the moving average in TradingView. This is simply to show the full code syntax of each language side-by-side.

Easy Language Code for Simple Moving Average Plot
Trading View Pine Script Code for Simple Moving Average Plot

Both written scripts are very similar with input options or “inputs” (variable values) which can be controlled through the script settings GUI and optimized while strategy backtesting. Both ignore any default value and require saving before loading onto a chart to view the moving average line.

Please spare writing comments about removing unneeded variables and placing the function call directly in the plot statement, etc. I wanted to show the cleanest possible code for demonstration purposes.

SPY TradingView Example

A quick primer on TradingView will serve all traders at this point. First, let’s open a page or chart of SPY – the most popular ETF in all markets – and take a look at what we see. Change the symbol in the upper left corner.

Next, open the Pine Script editor to create a new indicator or strategy. Select the Pine Editor and then hit Open. This is where creating custom indicators and all the code lives.

SPY TradingView Example OHLC Chart


Pine Script Example

indicator("IBR")
ibr = ((close - low)/(high - low + 0.000001)) * 100.0
plot(ibr)

Above (and below) is simple Pine Script code for a custom indicator that plots the Internal Bar Rank or the Internal Bar Strength. This is the IBR signal in Build Alpha’s built-in library. It simply plots the close in relation to the bar’s high-low range.

An IBR reading of 25% means the close was in the bottom 25 percent of the bar’s range (weak close). A reading of 90% would mean the close was near the high of the day (strong close).

Interbar Rank or Interbar Strength in TradingView Pine Script Code
Interbar Rank or Interbar Strength Indicator Code for TradingView Pine Script

TradingView Backtesting (quick note)

TradingView is much more than a charting platform as a free tradingview account gets you access to new features like technical analysis, price data, open-source scripts, the pine script language, built-in tradingview indicators, and the ability to backtest trading strategies.

It is important to note that TradingView’s backtesting is in its infancy and does not support all functionality that other platforms dedicated to backtesting (like Build Alpha, TradeStation, etc.) do.

This blog’s intentions are not to highlight the pitfalls or shortcomings of TradingView but to present it as an alternative for quantitative traders (often with a smaller budget or looking to trade across borders).

Build Alpha – Strategy Building with No Code

Build Alpha is no code algorithmic trading software designed to empower quant traders with fast prototyping and strategy testing for any market, timeframe or bar type. Build Alpha can backtest strategies and has its own signal generators (genetic algorithm) that builds the best strategies for you given your inputs. It was designed to be a huge time saver for those with big research to do lists (myself primarily).

Build Alpha Input Interface

After Build Alpha generates the best performing strategies based on your inputs, the trader can click to highlight any strategy and then press one button to generate fully automate-able code for a ton of platforms.

I am happy to announce that Trading View’s Pine Script is newly added to the latest Build Alpha release. Below I will cover a full example from setting up Build Alpha, generating the Pine Script code, and ultimately putting the generated code into Trading View to view the performance/compared to Build Alpha.

Create Custom Indicators with no programming language

To highlight another new feature in the latest Build Alpha release, we will create a custom indicator using the new no-code editor in BA (dark mode). Let’s create a signal that only trades if 3 or more of the last 5 bars have closed in the bottom 25% of their respective range (yes, the IBR indicator)!

Below is how it looks in the Custom Indicator Editor in Build Alpha. Click the pencil to edit the condition inside the ‘Count F’ function. 

Build Alpha Darkmode Custom Indicator Editor


Generate Algo Trading Strategy with no code

Next, let’s use the custom signal above to generate a trading strategy in BA. I wrote more about automating trading strategies with no code in this link for those interested: Automate with No Code

First, type in PineTest to the signal search bar and select it for Entry. I am going to require it as well (this forces the software to use it in every strategy it generates).

Selecting Custom Signals in Build Alpha

Next, let’s add the IBR signal by typing that into the signal bar and selecting it for Entry. I will not edit the ‘V’ value and will use the default signal that IBR is less than or equal to 25% (settings not pictured).

IBR Signal Selection in Build Alpha

Finally, let’s add a filter that the current price must be above its Simple Moving Average. Type SMA into the search filter and select Close less than SMA as an Entry signal. Additionally, let’s let Build Alpha find the best moving average length to use and give it a range from 10 to 250 stepping by 5.

Simple Moving Average Signal Selection in BA

Please note there are other SMA signal categories for crossovers, moving average slopes, etc.

I have set max entry rules to three, so we always have our two required rules plus one of the SMA variations in every strategy the software builds. The only exit is a one day hold (no stop loss for this test) and will run on SPY for demonstration purposes.

Generate TradingView Pine Script

After we hit Simulate, we can view all the variations to find the best performing SMA filter plus our two rules (IBR and IBR count).

Build Alpha Results Window Example

Click a strategy to highlight then click the Generate Pine Script Code button in the lower right. I’ve expanded them for the below picture, but they are collapsed (but still clickable) in the above photo.

Build Alpha Code Generators for Pine Script

Build Alpha will pop open a new window with full code that can be copy and pasted into Trading View’s Pine Editor including code for the custom indicator. Save and then place on a SPY chart to view.

Pine Script Generated Code Example Build Alpha

Below you can see the strategy’s equity curve on TradingView, Build Alpha, and TradeStation. TradingView is still in its infancy in regards to data quality, backtesting ability, and accuracy but I felt it was a close enough match that it was time to support TradingView.

Build Alpha, Trading View, and Tradestation Equity Curve Comparison

The more recent underlying data seems more accurate in TradingView. Here is a small sample of the last four trades to show an exact match in trade size, entry, exit, P&L!

TradingView Last Four Trades
Build Alpha Last Four Trades

TradingView Paper Trading

TradingView does support paper trading for users looking to build and incubate tons of strategies before going live. Once the generated pine script code is loaded on a Trading View chart you can watch the trading strategy on live price data on screen similar to a paper trading account without doing anything.

Build Alpha’s latest upgrade also has the ability to monitor strategies live and output real-time alerts, issue position updates and update P&Ls. Simply right-click on a strategy to save it to your BA portfolio and then enable it for Live Simulation.

Takeaways

  • Pine Script is TradingView’s proprietary programming language

  • Pine Script has many built-in trading related keywords and functions

  • Pine Script and Easy Language are very similar for those familiar with TradeStation

  • Build Alpha generates both TradeStation Easy Language and TradingView Pine Script code at the click of a button

  • Pine Script and TradingView’s backtesting accuracy is still in its infancy but coming along quickly

Summary

Trading View has taken over the trading world in the past few years with its easy to use web based charting platform. The introduction of their proprietary programming language, Pine Script, is proving to be a great resource for those traders understanding the need to quantify their ideas and looking for automation. Build Alpha now generates complete code for Pine Script for those that do not want to learn to program but still want to quantify their ideas, build robust strategies, and take advantage of TradingView.

Video example below of Pine Script code generation and matching results with Build Alpha:

Pine Script + Build Alpha FAQ


Can TradingView auto-trade my Pine strategy?

Yes, you can autotrade with TradingView using its alert sysetm to send webhooks to a third-party automation platform or directly to a supported broker.

Will TradingView and Build Alpha results match exactly?

They can differ due to data sources, backtest assumptions, and execution modeling. However, if you use the same data and align settings results will match (as shown above).

Can Build Alpha generate indicators too?

Yes, the generated code can be modified to work as an indicator, if desired. 

What You’ll Learn

  • How to generate NinjaTrader strategy code with Build Alpha
  • How to import/compile in the NinjaScript Editor
  • How to verify backtest matching and avoid common mismatches

How to Download NinjaTrader

First, create a free NinjaTrader account at NinjaTrader.com and download the NT8 NinjaTrader8 platform. Often Ninjatrader.com needs to review the security of your connection and may request you verify you are human by completing a simple captcha.

NinjaTrader 8

Currently NinjaTrader is on version 8. Build Alpha has supported NinjaTrader since NinjaTrader7 but now proudly supports Ninjatrader8. Make sure you download the latest version for the best experience.

NinjaTrader Brokerage Account

Ninjatrader is also their own broker, meaning you can open a real money account and trade directly through the Ninjatrader platform.

NT8 is a large reputable futures broker and were recently acquired by Kraken in a $1.5B deal. You can read about the deal here: Kraken to Acquire NinjaTrader: Introducing the Next Era of Professional Trading | NinjaTrader I imagine the trend of merging traditional finance and crypto will continue.

Futures Trading NinjaTrader

NinjaTrader is arguably the best futures broker available at the moment for retail traders and serious independent traders. NinjaTrader has a wide variety of futures data connections and has competitive margin requirements. You can trade all assets through NinjaTrader but it is particularly good for futures traders.

NinjaTrader Margin Requirements

NT8 has competitive margin requirements which can be found here: Margins for Available Futures Markets | NinjaTrader | NinjaTrader

NinjaTrader Automated Trading Systems

NinjaTrader also permits full automation of trading strategies using their proprietary NinjaScript programming language. The programming language is C# based and extremely flexible.

There are tons of existing functions, tools, indicators and strategy logic blocks for those that want to dive into the C# code. For those that do not want to write their own code, there is of course Build Alpha!

NinjaTrader Automated Trading Systems with No Code

Build Alpha generates fully operational NinjaTrader code at the click of a button with perfectly matching results across the two platforms. Build Alpha enables traders to build and execute their own trading ideas with no code and then easily transfer the generated code over to NT8 for live (or simulated) trading.

Build Alpha vs NinjaTrader Strategy Builder vs Coding

NinjaTrader has their own basic Strategy Builder which may be good for basic rules but can be quite limiting. It also only tests a single idea at a time and has no artificial intelligence to help arrive at better strategies for you.

NinjaScript – NinjaTrader’s proprietary coding language – gives maximum flexibility but requires coding time. It is C# based so it is not trivial for a non-coder to pick up.

On the other hand, Build Alpha generates thousands of strategies per second improving them using a genetic algorithm and artificial intelligence (my background in machine learning). BA also has the most advanced suite of robustness tests and completely exportable NinjaScript code.

Build Alpha vs Ninjatrader8 comparison

How to Automate Build Alpha strategies in NinjaTrader with no coding

First, let’s generate a simple strategy so we can talk about the same example. I selected a few thousand signals in Build Alpha, hit simulate, and selected a random strategy to review.

Build Alpha AI strategy Results Window

Next, hit the ‘Generate NT Code’ button in the lower right of the Strategy Simulation results window pictured above. NT stands for Ninjatrader8. Please note there are also Build Alpha code generators for

Below is a picture of the Build Alpha generated code for NinjaTrader8. Copy all the code by hitting CTRL + A (to highlight all) and CTRL + C (to copy all).

Ninjatrader8 Generated Code from Build Alpha

In NinjaTrader, go to New >> NinjaScript Editor

Ninjatrader Editor

In the NinjaScript Editor window, find Strategies and right-click to create a New Strategy.

Ninjascript Editor New Strategy Creation Window

The Strategy Wizard will open. Give your strategy a name and hit Generate. I chose ‘MyCustomName’ as the name for my strategy.

NT8 Strategy Wizard Name Custom Strategy

In the new window that opens, hit CTRL + A to highlight and then Delete to remove all default strategy text provided by NinjaTrader.

After completing the action, simply copy and paste the Build Alpha code into this blank file. Next, rename ‘SlaveY’ class name and ‘StrategyName’ to ‘MyCustomName’ which was the name I provided for the strategy – which can also be seen in the bottom tab of the NinjaScript editor (all in orange boxes below). Finally, compile the strategy by clicking the button in the green box at the top of the second image below. This saves your strategy in Ninjatrader8.

NT8 Default Code
NT8 Modified Custom Code generated by Build Alpha

Finally, open a NT8 chart and add the strategy to the chart (enable it in NT8 settings). Below I’ve added our strategy onto the SP500 Futures emini chart and pulled up the NinjaTrader strategy performance report to show the backtest results matching in both Build Alpha (left) and NinjaTrader (right).

Build Alpha and Ninjatrader Equity Curve and Backtest Results Matching Perfectly

Reminder: Please check your data connection before proceeding from the NinjaTrader Connections menu or you will not be able to load a strategy onto a chart.

Build Alpha’s generated code will include position sizing contracts, time of day, market conditions, entry and exit signals, risk management, session information, etc. In other words, the complete strategy developed or produced in Build Alpha with all settings you decide to use will be reflected in the generated NT code.

Market Data, Trade Entries and Trade Execution

Now that you have a strategy loaded on a NinjaTrader chart you can watch the live market data and the strategy will show live trade executions (sim or live) on the NinjaTrader chart. You have now built and automated a trading strategy in Ninjatrader8 with no coding using Build Alpha.

NinjatraderEcoSystem – Proud Partner

Build Alpha is also a proud member of the NinjaTrader EcoSystem. Meaning NinjaTrader has reviewed and approved Build Alpha as certified member of the NT8 developer community.

Icon for ninjatrader.com

To learn more about Build Alpha please check these resources

Everything you need to know about Monte Carlo Simulations

Failing strategies? Read the Robustness Testing Guide

NinjaTrader Automation FAQ

Does Build Alpha generate NinjaTrader8 strategies or indicators?

Build Alpha generates fully tradeable strategies. However, the generated code can be modified to serve as an indicator, if desired.

Do the results match exactly?

If you use the same data in both platforms, session templates, transaction costs then yes, the results will match. An example is pictured above.

Can the generated code be used to paper trade?

Yes, you can use the generate code for both paper trading and live trading.

Interactive Brokers ($IBKR) is both a retail and professional trading broker and software platform that can be downloaded directly from the Interactive Brokers website assuming you have an existing Interactive Brokers account. If you do not have an existing IBKR account create one here: Open Interactive Brokers Account

If you have an account, please download and install their software for desktops here: Interactive Brokers Download

To learn how to navigate the IB platform, check out this video: IBKR Short Video – TWS for Beginners – Getting Started

Finding Trading Strategies with Build Alpha – No Code

Build Alpha is a no code strategy builder that enables traders to build, backtest, and generate code for tons of automated trading strategies. This presents an option for those that do not want to learn how to program but still want to do algorithmic trading.

Build Alpha V3 Dark Mode

Generate Python Code for Interactive Brokers with Build Alpha

After generating automated strategies, simply highlight the trading algorithm you like and hit the ‘Generate Python Code’ button to get the full python code to use with Interactive Brokers. Later I will show step by step how to automate trading with Interactive Brokers using this generated code.

Build Alpha Generate Python Code for Interactive Brokers API

Build Alpha currently generates code for the following platforms

  • Tradestation
  • Ninjatrader
  • Multicharts
  • Metatrader4
  • Metatrader5
  • Interactive Brokers (python)
  • Pro Real Time
  • TradingView
Trading platform logos: Tradestation, IBKR, MultiCharts, Tradestation, Ninjatrader, Metatrader, TradingView

Additional Notes about Build Alpha

For those interested in adding custom signals to the existing 7,000+ built-in signal library, Build Alpha has both a no code custom editor and the ability to add custom signals via python. Build Alpha also has tons of alternative, non-price-based data to add context to automated trading strategies. Read more about that here: Build Alpha Breadth and Sentiment Data

To see more Build Alpha features please click here: Build Alpha features

Automate Trading with Interactive Brokers Python API

The generated strategy code will be able to access live and historical data to assess trading opportunities, calculate position sizes, weigh available capital, determine new buy and sell decisions, and ultimately send orders (market, bracket orders, advanced order types) directly to IBKR for execution for paper trading or live trading.

Step One: Configure IBKR TWS

In your Interactive Brokers Traders Workstation please go to Settings >> API >> Settings and do the following

  • Enable ActiveX
  • Untick Read-Only API
  • Make sure socket port is 7496 (live) or 7497 (simulated)
Interactive Brokers API settings in IB TWS GUI

Step Two: Configure the Python code

In Build Alpha, select the strategy you want then hit Generate Python Code (instructions above). Next, go to Tools >> Python Development Environment (pictured below)

Build Alpha Python Development Environment

Then copy and paste your code into a new python file and save it. Make sure to modify any contract expiration dates or symbols that may be different then when you originally generated the code.

Build Alpha Python Development Environment

Step Three: Run the Python Code

Once your strategy is configured and saved in a new file, you can simply hit ‘Run Module’ or F5 and the code will connect to IB, start monitoring data and issuing orders based on your exact strategy logic and settings from Build Alpha. Not difficult and all with no code!

Step Four: Monitor Your Live Strategies

Once your strategy or strategies are running live then you can see your orders, resting limit order status, filled trades log, profit and loss, overall performance, and account changes directly through the visual interface provided by Interactive Brokers’ Trader Workstation (pictured below from Getting Started with TWS | Trading Lesson | Traders’ Academy).

All of this is enabled through Interactive Brokers by utilizing their application programming interface or API. The Build Alpha generated python code includes logic so your strategy can communicate with IBKR through the Interactive Brokers’ API.

Above is a brief IB API Python example but for full depth please consult the Build Alpha User’s Guide or the Interactive Brokers API Python Documentation here: IBKR TWS API Documentation

What is an API?

In simple terms, an API or application programming interface is a set of instructions that one code developer shares with another code developer so that their respective codes can effectively communicate with each other. To learn more about APIs please check this out: Wikipedia API page

Some APIs require payment or a private api key for use. Some APIs are free and do not require additional money. Interactive Brokers API is free and has good security.

More Info on Interactive Brokers

Interactive Brokers is a professional trading brokerage and has great documentation. For instance, their step-by-step guide for those that want to try connecting their own python scripts to IBKR is very robust: Interactive Brokers Python API (Native) – A Step-by-step Guide. Additionally, IB is great for a handful of other reasons and compliments Build Alpha’s advanced tools quite nicely.

Paper Trading with IBKR

All IBKR accounts have the ability for a paper account or practice account which is recommended when initially learning how to connect code, trying new strategies or even just getting familiar with a new brokerage platform. Take it slow and understand what you are doing before putting real capital at risk.

All Asset Classes and Timeframes

IBKR and Build Alpha both support all timeframes and asset classes in one place. Accessibility is key in today’s markets. You can track intraday data and place orders for stocks, etfs, futures, mutual funds, forex and even crypto currency through a single IBKR account. This is a large advantage for those that want to master systematic trading and expand their trading portfolio.

IBRK Stock

Interactive Brokers is a publicly traded company. It was founded in 1978 by Thomas Peterffy, who remains chairman. The company is headquartered in Greenwich, Connecticut and has over 2 million users and nearly 3,000 employees worldwide. The stock trades under the ticker $IBKR hence my common use of the IBKR abbreviation throughout this article.

IBRK margin rates

Interactive Brokers is often lauded for their low percentage margin rates which can be found here: Margin Rates and Financing | Interactive Brokers LLC. Please do your own due diligence and caution when utilizing margin. The rates do get lower as you have a larger account – some power in having more capital.

Does IBKR have a trading simulator?

No, Interactive Brokers does not have a trading simulator, but you can utilize their paper trading account with live data. However, Build Alpha allows traders to generate, backtest, and build individual strategies and portfolios of strategies on any asset class, timeframe and bar type. The only no code multi-strategy portfolio testing software.

Build Alpha Multi-strategy Portfolio backtesting

Summary

There are many factors to consider when reviewing all current material and aiming to complete research on trading brokers such as Interactive Brokers. Do not immediately open an account or automate any trading at any broker without doing your own due diligence. However, please be aware that many professionals have at least one Interactive Brokers account due to its reliability, professionalism and financial stability.

Compare and contrast the value with the other brokerage platforms Build Alpha supports (Tradestation, Ninjatrader, Metatrader, etc.) in order to take full advantage of both the Build Alpha software and your fees when you execute trades in a live account.

Please reach out to me anytime through email or the contact form on the site regarding an Interactive Brokers account or anything else in this post.

Intraday Edge: Find strategies backwards

The Goal of Intraday Trading

A large consideration of developing trading systems should be how efficient our capital is working for us. The quicker we can realize profits, the more trades we can make thus allowing our capital to compound more quickly. Additionally, sitting in positions for long periods increases our risk to extraneous events.

On the other hand, it is typically easier to find daily or higher timeframe edges than intraday edges due to the increased noise in intraday data.

From Daily to Intraday?

Is there a way to reduce the time in a position which would increase our trade count (via number of strategies) which would then allow us to arrive at the law of large numbers more quickly and therefore allow our capital to compound more quickly?

Yep. One of the new features in Build Alpha, called “Intraday Edge”, is a tool which allows us to do exactly that. Intraday Edge allows us to dig deeper into daily trading strategies to see if we can make them more efficient by reducing their holding times into smaller intraday time windows.

Maybe we can capture most of the daily strategy’s edge during only a small portion of the typical holding time. That’s right.. turning daily strategies into intraday strategies.

Intraday Edge Trading Example

First, let’s take an original daily trading system to examine the power of this new feature. I will use a simple one rule strategy that:

  • SP500 Futures Contract
  • Long Only
  • Buy when close in bottom 20% of day’s range (IBR or internal bar strength in Build Alpha)
  • Exit 1 day later

This assumes about a 23 hour risk (i.e., one Globex trading session).

Intraday Improvement

However, what if we could dig into this strategy and realize that most of the gains only come from 1 am EST to 4 am EST? We can then reduce our holding time by about 87% which now only ties up our capital for 3 hours as opposed to 23! This gives us an additional 20 hours to utilize other strategies to continue to grow our capital while still capturing a large portion of the original daily strategy’s edge.

Imagine we only had enough capital for one strategy. This Intraday Edge feature can now make our capital work much harder by finding intraday edge strategies for multiple markets/times of the day. Tying up capital for 23 hours in one daily strategy vs. trading 7 different intraday edge strategies with the same capital.

*Original strategy can be reduced by Intraday Edge which allows other intraday strategies to be traded with the same capital that was orignially tied up by the daily strategy*

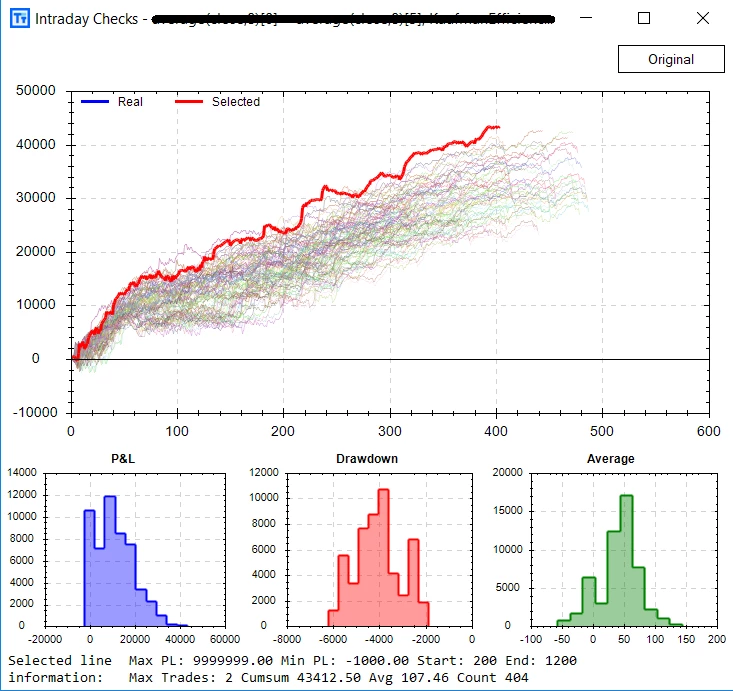
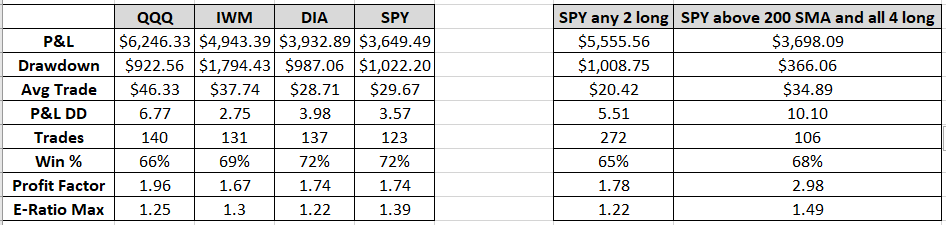
In the end, it makes our once daily system much more efficient. Check out the performance metrics of the original daily system compared to the new “Intraday Edge” version.

*Daily Strategy*
*Intraday Edge*

Steps in Build Alpha

So how can this be accomplished in Build Alpha? It is simple.

  1. Highlight any daily strategy
  2. Click the Test Settings in the bottom right to configure the intraday timeframe you want to use
  3. Hit the Intraday Edge button

Build Alpha will then search all possible holding periods within the original strategy’s trading duration to see if there is a more efficient version with reduced holding times. You can include the original strategy’s exit criteria such as stops, etc. or choose to exclude them. Flexibility to test everything is always key in Build Alpha.

Additional Uses of Intraday Edge Feature

Intraday Edge can even be used on different markets at the same time. For example, imagine an original system built on Gold daily bars but then we search for an intraday edge version that trades oil but only during this specific 2 hour window while the original Gold System has an active signal.

This Intraday Edge feature essentially allows us to search for intraday and multi-timeframe strategies in a new way. In this above Gold and Oil example we have a multi-timeframe AND intermarket strategy created from a simple Gold daily strategy.

You can still search for multi-timeframe and intraday strategies in the original/traditional way. That is, just searching the intraday data from the start. However, it is often faster and easier to find daily strategies then work them into intraday ones. At least now with Build Alpha you have the option to search both ways. Something not possible elsewhere.

Automating Intraday Edge Trading Strategies

And of course, all of the adjustments from the Intraday Edge feature are then applied to the code generators so you can automate these Intraday Edge systems with one click as with everything.

As always, I will keep attempting to add flexibility and ways to dig deeper so we can have the best trading strategies possible. Leave no stone unturned and test everything!

Thanks for reading,

David

Noise Test Parameter Optimization

In short, this is a new feature that allows us to optimize strategies across noise adjusted data series as opposed to the traditional method of optimization which only optimizes across the single historical price series. Here is a reminder on the Noise Test.

The problem we face is the historical data is merely only one possible path of what *could* have happened. We need to prepare ourselves for the probable future not the certain past. In order to do this, we can generate synthetic price series that have altered amounts of noise/volatility than the actual historical data. This provides us with a rough sample of some alternate realities and potentially what can happen going forward. This is the exact type of data that can help us build more robust strategies that can succeed across whatever the market throws at us – which is our end goal in all of this, right?

Noise Test Trading Strategy Example

Let’s look at a Noise Test Parameter Optimization (NTO) case study to show exactly how it works…

I have built a strategy from 2004 to 2016 that does quite well. The strategy’s performance over this period is shown below…

BuildAlpha NTOoriginal

Now, if we right click on the strategy and select optimize, we can generate a sensitivity graph that shows how our strategy performs as we alter some parameters. This is done on the original historical price data with no noise adjusted data samples added (yet).  We simply retrade different variations of parameter settings on the single historical price data and plot the respective performances. This is how most platforms allow you to optimize parameters and I want to show how misleading it can be to traders. The rule I’ve optimized had original parameter values of X = 9 and Y = 4 (black arrow). The sensitivity graph is shown below. Each plot consists of three points: parameter 1, parameter 2 and the resulting profit.

BuildAlpha Original Annotated Optimization

We can see the original parameters are near a “sensitive area” on the surface where performance degrades in the surrounding areas. Performance drops pretty hard near our original strategy’s parameters which means slight alterations to the future price data’s characteristics can degrade our strategy’s performance quite a bit. Not what we want at all and, as we all know, there will be alterations to future price’s characteristics! How many times has a backtest not matched live results? Perhaps more robust parameter selection can help…

Parameter Selection

The more robust selection using the typical simple optimization method on the historical data shows we should probably pick a parameter more near X = 8 and Y = 8 (pictured arrow below). This is the traditional method taught in textbooks, trading blogs, etc. We optimize on the single historical data then find a flat/non-peaked area close to our original parameters and use those new parameters.

BuildAlpha Where We Should Have Been

NTO Parameter Selection

However, if we run Build Alpha’s Noise Test Optimization with up to 50% noise alterations and 50 data samples (green box below), we see a much different picture. What this does is, instead of optimizing on one historical path we now optimize across the one historical path AND 50 noise altered data series. The sensitivity graph shows a much different picture when optimized across the 51 data series. We are less concerned with the total profit and loss but rather the shape of the surface…

BuildAlpha NTO Improves

The Noise Test Optimization (NTO) shows we should actually pick values of X = 8 and Y = 2 (arrow above). This area actually outperforms the ‘robust’ area from the traditional simple one data set optimization that most other platforms and textbooks show. In other words, I am comfortable picking a peaked area of the surface from the NTO results because the peak is true across noise adjusted values and not just a single price series. Secondly, if we fall off this peak then we are still at (or near) the highest level relative to the rest of the surface.

Forward Results

Looking at how all three of these parameter selections performed from 2016-2020 can be quite telling…

BuildAlpha Original Equity Curve
*Original Parameters 2016-2020*
BuildAlpha Traditional Equity Curve
*Textbook Parameter Selection 2016-2020*
*NTO Parameters 2016-2020*

The Noise Test Optimization (NTO) returned about $20,000 more profit per contract than the other two methods in this hypothetical case study or about 33% more profit over the same 2016-2020 period. These small adjustments to commonly misused tests can really make a large difference when spread across a portfolio of strategies. It is time to stop using outdated tools. I am not saying each strategy will show NTO results like this, but failing to check is a compounding mistake few of us can afford to make.

Build Alpha also possesses the ability to optimize parameters across a basket of symbols (and their noise adjusted data as well). For example, build a strategy for SPY but optimize it across SPY, QQQ, IWM and DIA.

As always, thanks for reading

David

Testing Across Markets, Trigger Signals, Signal Breakdown [New Update]

I wanted to give this latest version of BuildAlpha its own blog post as there are a few features that deserve a more thorough explanation to fully understand their power. I will highlight three of these new features below.

1. Testing Across Markets

The latest version allows the trader/money manager to develop strategies across a basket of instruments as opposed to just one symbol. For example, one can select Gold, Oil, SP500 and 30 Year Bonds (as well as thousands of signals at once) and the software will find the best strategies based on the combined performance across the selected instruments. You can also build trading strategies that are trained on various timeframes at once. For example, a basket can consist of 30 minute data, 240 minute data and daily data and the software will find the strategies that work best across all these timeframes. I first mentioned this technique of testing across markets to reduce the chances of curve-fitting in this blog here: https://www.buildalpha.com/3-simple-ways-to-reduce-the-risk-of-curve-fitting/

Testing across markets (and/or timeframes) is a great way to find robust strategies that generalize well and help to combat over-fitting. If you don’t believe me, take Jaffray Woodriff’s word for it. Woodriff, the founder of $3 Billion Quantitative Investment Management, was recently in the news for his $120M (yes, million) donation to the University of Virginia’s data department. In the book Hedge Fund Market Wizards, Woodriff was asked what changed from his early years when he was slightly down for two straight years to when he made over 80% in just the first six months of the following year. Here is his response straight from the book

“I started to figure out that the more data I used to train the models, the better the performance. I found that using the same models across multiple markets provided a far more robust approach. So the big change that occurred during this period was moving from separate models for each market to common models applied across all markets.” Pg. 146

Furthermore, if (when) the market changes then strategies built on multiple (and even better, diverse) markets should stand a better chance of surviving as they’ve been built across different data sets.

Build Alpha now makes it incredibly simple to build and test ideas and strategies across multiple markets at once. Just select one or as many markets as you prefer from the drop down menu and Build Alpha will return the results of the strongest strategies built across the entire basket. The ability to analyze the aggregated results as a basket as well as analyze the individual components is extremely simple.

The top row is the aggregate performance of the entire basket denoted by the symbol ‘BSK’. If you click the top left arrow it will drop down the basket’s components with their respective indiviudal performance.

Note: I am not saying that single market models do not work! They most certainly do, and there are certainly players that only participate in specific markets thus creating idiosyncratic patterns and opportunities. Of course the BuildAlpha trader can still search for single market models in BA as well. Flexibility is always key!

2. Trigger Signals

A trigger signal is the combination of two rules or signals occurring within a specified time window. We assume the main signal is occurring right now and then require that the second signal – the trigger signal – had to occur at least once in the last N bars for the full combined signal to be valid.

A simple example is to consider these two signals

  1. Close crosses above the 20 period SMA (main)
  2. Close is below the lower Bollinger Band at any time in the last 5 bars (trigger)

If we cross above the 20 SMA today and at any point in the last 5 bars we also closed below the lower Bollinger Band then we have an active signal.

Adding a ‘trigger’ to a signal can greatly improve the edge of the main signal. I ran a simple test using the above Trigger Signal on a basket of securities (ES,NQ,US,SPY,QQQ,TLT) and viewed the combined E-Ratio.  The original main signal (with no trigger signal) is seemingly random with an aggregated E-Ratio of only 1.02. However, adding the trigger signal jumped the E-Ratio to 1.39 – a 36.27% improvement.

Additionally, the E-Ratio for the main signal when just considering the 30 Year Bond Futures (symbol US) improved about 100% from 1.05 to 1.92 with the addition of the trigger signal.

To create trigger signals simply go to File -> Custom Indicators and set type to Trigger. Here is an example of the above Trigger Signal:

And here is a visual (pink dot is a true signal with trigger and blue dot is a true signal without trigger)

More on these in future upgrades..

3. Signal Breakdown

The final new feature I want to discuss allows us to view EVERY signal Build Alpha has (currently 5000+) and the likelihood it occurs on our winning trades as well as the likelihood it occurs on our losing trades even if it is not included in our original strategy’s rules. Why is this helpful? Well this can give us insights into what signals, rules or filters we can add (or exclude) to improve a strategy.

For example, if you knew that a specific signal occurred on 75.32% of your winning trades and on only 14.75% of your losing trades would you want to include this rule in your strategy to see if it improves results? Of course.

Additionally, if you knew that a specific signal occurred on only 18.37% of your winning trades but on 84.69% of your losing trades would this not be a rule you’d want to exclude from your strategy – in other words, avoid trading when this rule is true as it appears only true on losing trades!

The Signal Breakdown can be a powerful tool to help improve, tweak and understand strategies. However, caution is advised to still follow proper testing procedures such as in and out of sample testing, etc. There are other posts regarding this matter.

Why doesn’t Build Alpha find these rules initially? It does, but the user also has the ability to limit the software to generate the best strategies only using a user specified maximum number of rules. If the user wants to later add an additional rule then using the Signal Breakdown can lend insights into which additional rule(s) to add.

As always, thanks for reading and your support. It means a lot.

Thanks,

Dave

Ensemble Strategies [Reduce Overfitting By Combining Strategies]

What is an Ensemble Method?

“In statistics and machine learning, ensemble methods use multiple learning algorithms (trading strategies in our case) to obtain better predictive performance than could be obtained from any of the constituent (individual strategies) learning algorithms.”

A simpler example would be to consider it as a voting system. Imagine 3 SPY strategies. In theory (and every individual case needs tested), if one strategy says long and the other two say flat (or short) then long is not a very confident position. On the other hand, if two or all three strategies say long then it is a more confident long entry.

It is also important to point out or imagine the market as a living breathing organism that is constantly evolving and dynamic in nature. So imagine having a strategy on Oil, Gold, Bonds and Stocks. Now you can get a better picture of what is happening in individual markets and how their combination or interaction can help predict what to do next in a stock index or the US dollar strategy, for example.

This is slightly different than intermarket strategies because intermarket strategies simply include ‘signals’ from secondary markets. Ensemble strategies are actually using the strategies themselves which undoubtedly carries more information than just the signals themselves.

Ensemble Strategies in the real-world and Finance

The first example, is about the Netflix challenge where Netflix offered a million dollar prize for the “best suggested movies to watch” algorithm. Jaffray Woodriff, founder and CEO of Quantitative Investment Management ($3B in AUM), competed in the contest and took 3rd! Woodriff is a big proponent of ensemble methods and mentions such in his Hedge Fund Market Wizards chapter of Jack Schwager’s great book. The team that actually won the contest was in a close race with the second-place team and wound up running away with the first-place prize by using an ensemble method applied to the other top 30 competitors’ models. I am trying to convey financially incentivized practicality here; the story comes from Ensemble Methods in Data Mining by Giovanni Seni and John Elder with a foreword by Jaffray Woodriff.

Ensemble Strategies and Trading

The two main things that plague trading strategies are

  1. Underfitting (bias)
  2. Overfitting (variance)

In the latest book sweeping the Quant world: Advances in Financial Machine Learning Ensemble Methods have their own dedicated chapter! In this chapter, the author Marcos Lopez de Prado (head of AQR’s machine learning division and formerly founded and led Guggenheim’s Quantitative Investment Strategies that had over $13B in assets) states,

“An ensemble method is a method that combines a set of [weak] learners… in order to create a [stronger] learner that performs better than any of the individual ones. Ensemble methods help reduce bias AND/OR variance”.

So ensemble methods can help reduce overfitting? That sounds desirable for every system trader I know!

Quick Ensemble Tips

  • Ensemble strategies will be better the more diverse the individual strategies. For example, use one strategy that looks at volume, one that looks at price action, and one that looks at spreads or intermarket signals.
  • Do not try and ensemble very poor individual strategies and expect miracle improvements. Simple ensemble methods such as bagging, cannot improve the accuracy of such poor systems. So, you still have to put effort in designing the individual strategies! Ensembling is not a shortcut that can turn dirt into gold; however, it can polish up some things very nicely.
  • Finally, ensembling (with bagging) is more likely to be successful in reducing variance (overfitting) than reducing bias (underfitting). This attacks the BIGGEST problem we have as system traders and developers.

Ensemble Strategies and Trading in Build Alpha

We can now select individual strategies that we want to use in the overall simulation. This means we can build strategies that only take a position when another strategy has an existing position. This is a great way to create hedging strategies (more on this in a later post/video).

The above ‘signal’ (if used) would only enter a trade when our strategy ‘SPY Strategy3 Trend’ has an existing position. This is a simple way to build hedgers, or use confirmation from other strong systems.

If you mark strategies in your Build Alpha portfolio as ‘Active’ then they can be used in ensemble strategies. The below selected signal would only enter a position when at least 2 (any 2 of your active strategies) already has a position. You can also select all the ‘at least’ signals and have the software find the best combinations of your existing strategies to use in an ensemble strategy.

Ensemble Trading Strategies and Hedging

This new feature in Build Alpha gives system traders an unique advantage never before offered. We can now create ensemble strategies at the click of a few buttons and completely automate them.

How Can I Make Ensemble Strategies Only Using The SPY Strategies?

If you have a few diverse strategies in your portfolio and want to create an ensemble only using a few of them then make sure the strategies you want to include in the ensemble are the only ones marked active in your portfolio. Below I’ve only marked the SPY strategies as active in my portfolio (left photo). Then when I select at least 2 on the right photo it means it will trade whenever at least 2 of the SPY strategies are in a position.

How Can I Make Ensemble Strategies Only Using The Non-SPY Strategies?

Simply change the active strategies in your portfolio by unselecting the SPY strategies and selecting the others.

How Can I Make Ensemble Strategies Using All The Strategies From My Portfolio?

You guessed it… just mark all as active. Now all strategies in our portfolio will be considered for ensemble strategies in Build Alpha’s strategy building process.

Note the above green box with the 1004 + 1000 numbers. This means that I have selected 1000 technical signals to use in the strategy building process plus 4 ensemble signals. I have also selected 1000 technical exit signals to include in the strategy building process. Now Build Alpha will create the best strategies it can given your inputs. You can also right click to ‘require’ any signal (including ensemble signals) to force the software to use that signal in the strategy building process.

Small Accounts

Ensemble strategies are great for smaller accounts too. If you cannot afford to trade multiple strategies, but have created a few then you can still capture the information of all the strategies by ensembling them into one ensemble strategy. Then you can trade this ‘master’ strategy with a smaller account than trading all the individual components. So better use of capital and less overfitting? Sounds good.

Ensembles: A Case Study

This is a simple case study showing the RSI2 strategy outlined in Larry Connors’s book Short-term Trading Strategies That Work. I have applied the strategy to the individual equity index ETFs and then shown the results of two different ensemble strategies of these four strategies applied to SPY.

The first ensemble strategy takes a position in SPY whenever two of the four individual RSI2 strategies have an existing position. It does not matter which two markets are trading at the moment, but it will trigger a SPY trade. This first ensemble strategy does better than three of the four individual components on most metrics, but specifically profit and loss to drawdown ratio.

Furthermore, if we look at the second ensemble strategy that only trades SPY when the RSI2 strategy has an active trade in all four of the equity indexes AND SPY is trading above its 200SMA then we can improve the profit and loss to drawdown ratio to over 10! Significantly better than any of the individual strategies.

Ensemble Methods Summary

Ensemble strategies combine multiple strategies to create a more powerful ‘master’ strategy. Ensemble strategies help reduce overfitting (curve fitting) which is the biggest plague us system traders and quant traders face. They have been shown in real-life trading, financially motivated contests, and as well as with large hedge funds to be superior to simpler trading strategies and machine learning models. BuildAlpha can now help you build, employ and automate ensemble strategies with a few clicks. Private videos for users now up!

2018 Year End Update

It is becoming more and more commonplace for large quantitative firms to use ensemble methods.

The future (and even the present) of quantitative finance is the discovery and deployment of ensembles of many marginal edges – even weak predictors. These smaller edges will not attract academic or practitioner interest because they may not be sufficiently profitable on their own, but combined in an ensemble can be very powerful. It is even believed Renaissance Technologies had this breakthrough a while ago and that has manifested/propelled them into the greatest Hedge Fund of all time.

A small and anecdotal example is the year end performance of this popularized RSI2 trading strategy. The individual strategy ran on the single markets resulted in

  • SPY -$17.5 per share traded
  • DIA +$0.24 per share traded
  • QQQ -$1.07 per share traded
  • IWM -$20.50 per share traded
  • Ensemble +$2.79 per share traded

An overall weak year for this strategy, but improved by the ensembling described above. Ensembles are just another tool in our arsenal with Build Alpha to build the trading portfolio we need! Cheers guys.

Thanks for reading,

Dave

A Strategy For Each Day of the Week [Seriously?]

A different strategy for each day of the week? Sounds crazy, but is it?

I have wrote about “Turnaround Tuesday” before.

This simple strategy is actually at new highs since this was published over 10 months ago!

But what about other markets? Is it possible to just trade one market per day of the week (from open to next day’s open) on a specific day of the week and still do well? If you would have followed this simple “portfolio” below for the past 15+ years then yes.. you would have.  You wouldn’t even of had to sit in front of the screens like the rest of us degenerates..

Strategy 1: Short Crude Oil on Mondays

Simple strategy dating back to 2003. Short Oil on Monday’s open and cover on Tuesday’s open. Results based on a 1 lot.

Strategy 2: Turn Around Tuesday

If Monday was a down day (Monday’s close less than or equal to Monday’s open) then buy Tuesday’s open and sell on Wednesday’s open. Results based on 1 lot.

Strategy 3: Long Gold on Friday's. Weekend Risk.

Maybe in lieu or anticipation of bad weekend news releases, buying Gold on Friday’s open and holding over the weekend to exit on Monday’s open has produced the following based on 1 lot.

Portfolio of Strategies

Not a bad portfolio equity curve, right?! One of the hidden ‘holy grails’ in trading is combining systems together to smooth the equity growth of the account. No one single super star out of any of these 3 strategies but combined their curve starts to look rather nice.

Utilizing Build Alpha for Seasonal Edges

Sure these might not be alpha generators on their own but maybe they can be combined with some other price patterns, filters or targets and stops to become full strategies. They can certainly act as intermarket or multi-time frame filters for more complicated strategies.

For example, if you have a 60-minute mean reverting system that buys oil dips then maybe it should be turned OFF on Mondays! At the very least it is worth a look, and this is all made very simple with Build Alpha – just point, click, test.

Odd vs Even Days

For example, did you know S&P500 has performed much better on even days than odd days? (April 6 is an even day).

Takeaways

Anyway, I just wanted to show some simple things that can be tested in Build Alpha and how sometimes the simplest ideas turn out to work the longest. Maybe because people think they’re too simple and that they can’t work? I don’t know.

Either way I have put some python code (and TradeStation code) in the private Build Alpha users’ forum to specify day of the week as I know a lot of you are trying to learn python so I figured I’d help out a bit. But day of week is all point and click options pre-built into Build Alpha’s signal library for those of you who could care less about learning to code! Build Alpha has support for various seasonal filters such as:

  • Day of week
  • Day of week combos
  • Trading Day of Week
  • Trading Day of the Month
  • Trading Days Left in the Month
  • Trading Day of Quarter
  • Trading Day of Year
  • Month
  • Quarter
  • Even or Odd
  • and More

Happy Friday.

Cheers fellas,

Dave

Three Trading "Truths" Quantified

I want to discuss three trading “truths” that I often heard but when I finally got into testing ideas found them to be myths. These discoveries were instrumental in turning my trading around.

For those that know my story, it was not all roses and rainbows – what trading story is?!? I actually “learned” like a lot of traders from online sources, chat rooms, webinars, and eventually found the right circles to roam in after a LOT of trial and error. I was then lucky enough to land a job with a high frequency trading firm. I was quickly made to realized that much of what I thought trading “was” was most certainly false.

In an attempt to show me the light, a few of the quick trading axioms they wanted to disprove to me were simple “well known” trading ideas that have been around for years but were in fact large falsehoods. I quickly realized beyond this list of three examples there must have been many, many more “trading truths” that were causing my account harm and doing my trading aspirations a disservice.

I then realized the value in testing everything and quantifying my entire approach. It wasn’t until this point in my journey did I get out of the “rat race” of trading… the ups and downs, the barely consistent, always doing slightly better but not really getting anywhere trading most of the traders I meet today are going through.

I cannot stress the importance of testing everything and quantifying your trading edge. Investigate these trading axioms. Otherwise, you will be stuck in randomness until your account random walks to 0. For more on my journey check out this podcast I did chatwithtraders.com/103 

Below you will find my three favorite trading “truths” quantified.

Trading “Truth” #1 - Bearish Engulfing Candle

This one is great because many are familiar with Japanese candle stick patterns and the name implies such a negative move in price that one cannot help but to shift their bias to the downside. These candlestick patterns are often traders first introduction to technical analysis.

The pattern is defined as a bearish candle that “engulfs” the range of the previous day. I also like to look for a negative close and preferably a close below the previous session’s low. Here are a few pictures of bearish engulfing candles.

The truth is that this pattern has been one of the most bullish (not bearish) one day signals for the SP 500 over the past 15+ years. Did you know that the day following a bearish engulfing candle actually closes higher 61.72% of the time in the SP500 futures and 65.33% of the time in SPY ETF? The day following a bullish engulfing candle only closes higher 54.05% of the time in the SP500 futures and 51.70% of the time in SPY. You tell me why they’re named how they are!

Trading Truth #2 – Above a moving average is bullish and below is bearish

Most of the time this is true but it depends on the moving average, moving average length, and the market. I recently came across a few blogs that mentioned using a short term moving average as a sign to exit long market exposure and wait for sunnier days. In reality, this sounds great; however, analyzing the data this can be an extremely misleading “truth”.

Below is a chart plotting the equity curve if you would buy every close when the SP500 is BELOW the 8 period simple moving average (8SMA) and sell the next bar (repeating until above 8SMA). The second chart is if you were to buy every close when the SP500 is ABOVE the 8SMA and exit the next bar (repeating until below 8SMA). Yes, being below this moving average is actually better for long returns.

Of course this is not true for all markets and moving averages, as mentioned. I pointed this out in another post on SeeItMarket where I dissected popular stocks and different moving average lengths here: https://www.seeitmarket.com/testing-moving-averages-popular-stocks-etfs-16809/

The point is that these trading truths like “above a moving average is bullish” and “below a moving average is bearish” need to be quantified and tested. It is important to stop thinking trading truths can be generalized to every market, timeframe, indicator value, etc. and just verify them yourself and you’ll be much better off!

Trading Truth #3 – Overnight Exposure is Risky

Sure earnings announcements and large unexpected news announcements typically happen after market close. Does this mean we should avoid trading overnight, if possible? So many want to day trade and be flat on the close that they miss a lot of gains from the overnight session (sometimes all of them).

Below you will see 30 top stocks where I breakdown their returns in the day session compared to the overnight session. The blue line signifies if you bought the open and sold the close the same day (day session) and the orange line signifies buying the close and selling on the next day’s open (simulating overnight exposure). As expected, there are no generalities in trading truths. Some stocks exhibit that most, if not all, returns come from the overnight.

Don’t get me wrong there are certainly edges to be had from avoiding overnight exposure and there can also be value added by increasing overnight exposure. Again, I am just making the point to dig deep into the data and understand where the edge(s) actually live.

Quick note: You can easily test overnight holds in Build Alpha by setting max hold to 1 bar and setting entry to this bar close and exit to next bar open in the settings menu.

In conclusion

Not all trading truths are “truths”. There are many that still have value! The edge is not in these truths but in determining the difference between a truth and a “truth”. Most do not take the effort to investigate these trading axioms found in trading books, blog sites, chat rooms, etc. If I have one goal then it is to make traders realize the value in testing everything – it is something I wish I would have started earlier. It is a super power to quickly test these ideas and trade/act accordingly!

I think many traders shy away from digging into the data because it requires effort and they think it will be a hard and arduous journey before they find some gold. But now I think it is increasingly easier than many may think.

That’s why Build Alpha’s main goal was (and still is) to make this type of testing easier for those with no programming skills or those tired of crunching endlessly in excel. The game is changing and things like this can be easily tested now. Now trading just comes down to those who will put in the work and who won’t: this should greatly increase your odds for success if you’re part of the former group.

Thanks for reading,

David

Mean Variance Optimization [Portfolio Construction]

What is Mean Variance Optimization?

Here is the definition from Investopedia.com“Mean–Variance analysis is the process of weighting risk (variance) against expected return. By looking at the expected return and variance of an asset, investors attempt to make more efficient investment choices – seeking the lowest variance for a given expected return or seeking the highest return for a given variance level.”

It also assumes investors are rational and would choose the asset that had lower variance if the expected return of two assets were equal. I will assume you all are!

In layman terms, there are many techniques of portfolio construction, but this test shows two things. 

  1. Does adding a strategy increase the overall risk:reward of your portfolio or not?
  2. What are the appropriate weights each strategy in my portfolio should be assigned?

This is certainly a crude explanation of mean-variance optimization, but this isn’t an academic blog.

Testing Mean Variance Optimization

This test can be done with either historical or “predicted” returns. We will assign random weights to each of the strategies in the portfolio; the sum of all the weights shall equal 1 (or 100% of allocated capital). After assigning weights to each of the strategies we can generate a risk-adjusted return value or Sharpe Ratio. This is the Sharpe Ratio had we traded each of these strategies with the weight we just assigned to each.

After thousands of tests assigning random weights, we generate a plot of the thousands of Sharpe Ratios. We are trying to find the best weightings to lower the variance in our portfolio while keeping the return as high as possible.  The leftmost dots create the Efficient Frontier and the leftmost dot is considered the minimum variance portfolio. The graph’s legend or color bar shows the highest Sharpe Ratio possible. This portfolio contains the three “checked” strategies on the far left of the photo below and the highest Sharpe from this portfolio is 2.17.

We can then hover over the graph and view the weights that produced a specific Sharpe value or dot on the chart.  The idea here is we can see how to weight the strategies in our portfolio to give us the “optimal” or best risk-adjusted reward (optimal portfolio construction) – which is our ultimate goal as trading system developers.

The red dot shows equal weights or how our portfolio would have performed had we traded each strategy with the same position size.

Does this strategy improve my portfolio?

Now to answer the question “does adding this strategy to my portfolio help or hurt expected performance”?  In Build Alpha’s portfolio mode, you can simply include or remove strategies and quickly see if the Sharpe Ratio increases or decreases with this Mean Variance analysis. Below I have selected one additional strategy (see four checks on the far left of the photo below) and you can see a Sharpe Ratio improvement from our original 2.17 to 2.50.

Adding new individual strategies will almost certainly “smooth” out the portfolio’s equity curve, but does it actually increase risk: reward? This test gives a simple, quick way to quantify the addition (or subtraction) of a strategy.

Next Test

Here I have changed the ES (S&P500 strategy) in the portfolio. I unselected the top ES strategy and selected the other ES strategy. You can see the Sharpe Ratio worsening as it appears this portfolio only achieved 2.28 (vs. previous portfolio configuration of 2.50). This is a good strategy but just does not work as well with the other strategies in the portfolio as the original ES strategy we had included.

Mean Variance Optimization Summary

We want our money to be as efficient as possible and this test or techniques of portfolio construction gives us another check if it is or not.  No point in trading a strategy that is not expected to increase our overall risk reward.

It is now much simpler to compare strategies or to decide whether or not to include a strategy into a portfolio or not. Much of trading comes down to making informed decisions that maximize risk:reward and running this type of analysis certainly increases the information at your disposal. It is now only one click away in portfolio mode.

-Dave

PS: Build Alpha allows traders to import systems built outside Build Alpha for analysis and portfolio construction. Now you can do all of this analysis on Build Alpha strategies, your own strategies, or any combination between.

Author

David Bergstrom Author Photo Trading Edge

David Bergstrom – the guy behind Build Alpha. I have spent a decade-plus in the professional trading world working as a market maker and quantitative strategy developer at a high frequency trading firm with a Chicago Mercantile Exchange (CME) seat, consulting for Hedge Funds, Commodity Trading Advisors (CTAs), Family Offices and Registered Investment Advisors (RIAs). I am a self-taught programmer utilizing C++, C# and python with a statistics background specializing in data science, machine learning and trading strategy development. I have been featured on Chatwithtraders.com, Bettersystemtrader.com, Desiretotrade.com, Quantocracy, Traderlife.com, Seeitmarket.com, Benzinga, TradeStation, NinjaTrader and more. Most of my experience has led me to a series of repeatable processes to find, create, test and implement algorithmic trading ideas in a robust manner. Build Alpha is the culmination of this process from start to finish. Please reach out to me directly at any time.