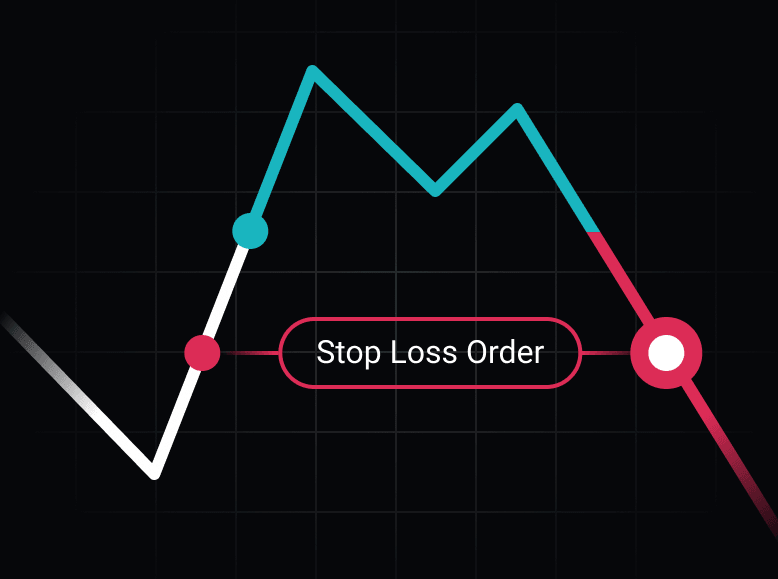
What is a Stop Loss?
A stop loss is an order to close an existing position to limit losses when the market reaches a certain price. A stop loss is a form of risk management and intends to serve as protection from more severe trading or investing losses. The purpose of a stop loss is to automatically exit a trade when the trader cannot stomach more pain in the trade or the set up has been invalidated. Before we get into all the types and variations of stop losses including the trailing stop loss, let’s become masters of understanding stop losses as a money management tool.

How Does a Stop Loss work?
A simple stop loss example is Cody buys 100 shares of Apple stock at a purchase price of $104.00 to open a long position (aiming to profit from a rise in AAPL stock). Cody does not want to risk more than $200 on his trade.
If AAPL’s price falls to $102.00 then Cody’s 100 shares would result in a $200 loss. Cody can set a stop loss order at $102.00 so that if and when AAPL falls to $102.00 his shares will be automatically sold.
When the market price reaches the stop price, the stop-loss order is converted to a market order and is generally executed immediately thereafter assuming during market hours. It is important to note that the market’s liquidity will determine the actual fill price of the stop loss order after conversion to a market order.
If there is a buyer bidding to buy at least 100 shares at $102.00 then Cody’s stop loss order will sell to that buyer at that share price thus closing his position for a $200 loss.
However, if the best bid for 100 shares is at a lower price of $101.98 then Cody’s stop market order to sell will be executed at a stock price $0.02 below his stop level resulting in a loss of $202. This is because the stop loss order converters to a market order and takes the available current market price.
Market Price or Limit Price? What is the difference between a Stop Loss and a Stop Limit Order?
In the example above, the best bid could have been $101.08 instead of $101.98 and when price falls below the stop and the next available market price is significantly below the trader’s desired exit level then significant losses may ensue.
What if in this scenario Cody would prefer to hold the position and wait for the share price rises or current price to recover before selling?

The stop limit order allows the trader to enter a stop price and a limit price which converts the stop order into a limit order (instead of a market order) after the stop price has been hit. Then the trade will be executed at the limit price (or better). This could alleviate some of the concerns around market orders.
Let’s revisit Cody’s position from earlier and assume he placed a stop limit order with a stop price of $102.0 and limit price $101.90. In the first example, Cody’s transaction price would be $101.98. In the second example, Cody’s stop would trigger but the limit order would never execute because price was already below his limit price ($101.08 vs $101.90). In this scenario, Cody would hold the shares and until the security price rebounds (hopefully).
The big difference is that a stop loss converts into a market order and a stop limit order converts into a limit order. The risk with stop limit orders are thinly traded markets or gaps beyond the stop limit. There are no stop limit orders guarantee to get filled at the specified limit price.
How to Calculate Stop Prices? Where to place them?
Method 1: beyond a recent high or low-price level
Those using technical analysis and chart patterns to trade will advise you to put a stop below (above) a recent low (high) that would invalidate the chart or pattern that prompted the entry.
However, one should not choose the minimum price below the most recent low but a decent margin below the recent price level so all the stock drops and natural volatile markets can happen without stopping you out of your position prematurely.

However, I have now spent years working with a high frequency trading, market making firm and I can assure you this is not a great strategy for existing positions especially in fast moving markets. We joke and call this the “draw a line stop loss”. This rings true for long and short positions and all trading hours.
Method 2: based on your risk tolerance
Another exit strategy to determining when to sell stocks on adverse price moves is to determine your entry, determine how much you are willing to lose and place your stop sell order at this amount. This may apply to traders that have pre-determined their position sizing based on the entry or their account size.
This strategy lacks forethought and traders must realize the market does not care where your pain threshold is. You may choose a price level that can be hit easily.
Method 3: something testable
Calculating stop loss orders is no different any other part of your trading system; that is, it should be fully testable. Often times using method one above does not result in something that can be backtested. Often times backtesting can result in isolating situations that produce more money or more favorable market conditions. This can also apply to placing sell stop or limit orders. Some easy ideas for something testable are:
- fixed dollar amount
- fixed Average True Range amount
- dynamic dollar amount
- a rolling N-day low (or high for a short position)
What is a Trailing Stop Loss?
A trailing stop loss aims to protect profits moving the stop price higher as the market price moves higher. Trailing stops are often an excellent tool to protect gains and combat market volatility that wishes to shake you out of profitable positions. Of course, one can use either a trailing stop market order or a trailing stop limit order.

As the trading day progress and the trade becomes more profitable, the trailing stop can be updated instantaneously or at the end of each bar.
How to Calculate a Trailing Stop Loss?
Trailing stops are typically calculated from the maximum trade price or high watermark while in a long trade. Short positions just have reversed logic calculating from the minimum trade price during the trade.
Cody’s original transaction price was to enter a long trade at $104.00. Let’s assume Cody placed a $1 trailing stop which would initially start at $103.00 or $1.00 below his entry price. After the market opens, AAPL’s price shot up to $104.77 raising Cody’s trailing stop price to $103.77.
If trading fails to make a new high above $104.77 then Cody’s trailing stop would remain unchanged at $103.77. However, if the security price rises to a maximum price of $105.66 then Cody’s trailing stop would move to $104.66 which is above his entry price of $104.00. At this point, Cody has “locked” in some gains even if price drops. However, investing involves risk and anything can happen (look above to thinly traded or overnight gap risk comment).
What is the best Stop Loss strategy? Static or Dynamic?
Stop losses, stop limit orders, trailing stops, oh my. What are the best stop loss strategies to add to your trading systems? First, let’s discuss a few variations of what we have discussed so far.
Static vs Dynamic Stop Losses
A static stop loss is a stop that is calculated the same way regardless of the current market price and market volatility. For example, a trader may employ a $200 stop for every trade he places regardless if the stock price significantly moves from the time of his first trade to the time of his most recent trade.
Static Stop Loss Pros
- Simplify what to expect
- Always understand your risk
- Easy to think in fixed (static) terms
Static Stop Loss Cons
- Fails to account for changes to underlying
- Fails to account for different volatility regimes
A dynamic stop loss is calculated based of the underlying price or market volatility. This allows the sell stop order to maintain an appropriate distance from the entry regardless of the market conditions. In periods of high volatility, the stop price will be farther from the stock price and in periods of low volatility the stop price will be closer to the stock price dynamically adjusting how “risky” the trade is.
Dynamic Stop Loss Pros
- Adjusts to current market environment
- Accounts for drastic changes in the underlying (stock going from $50 to $500)
Dynamic Stop Loss Cons
- Difficult to calculate on the fly
- Difficult to think and understand your risk quickly

Is a Stop Loss a good idea?
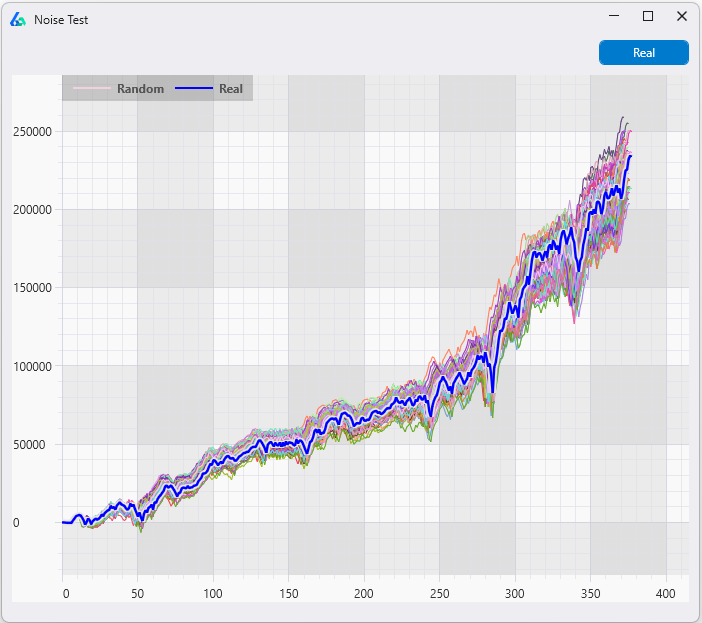
In some cases, a backtest may show a strategy perform better without a stop loss. This is much more common in mean reverting strategies as price tends to move farther away from the mean, the edge or advantage of entering (or holding) the trade actually may increase! A stop loss in this scenario could limit upside and increase what you pay in exchange commission and broker fees.
Here is a popular 2-period RSI strategy tested across common market ETFs SPY, DIA, QQQ, and IWM. The strategy buys when 2-RSI crosses above 20 and sells when 2-RSI crosses below 80.

The equity curve on the left shows using a fixed stop loss of 1% or $100 per trade assuming $10,000 per position. The equity curve on the right shows the same strategy with no stop logic! Neither strategy is great as a standalone but the version without a stop produced 2x the net profit in backtests.

On the other hand, trend following, or convex strategies almost always benefit from having a short leash for when a stock falls.
Position Sizing based on Stop Price
The late Dr. Van Tharp wrote extensively about calculating position size based on the distance between your entry point and your stop loss. Here is his complete guide: Van Tharp Position Sizing
In short, the trader determines what percentage of his account is acceptable to risk. Typically, this is set to 2%. Let’s assume Cody has $100,000 account so he is willing to risk 2% of $100,000 or $2,000 per trade. Cody has determined his stop loss order to sell be placed at $102.00 or $2.00 below his $104.00 price entry or the prevailing market price.
We can then calculate how many shares Cody should purchase by dividing the $2.00 distance by the $2,000 max risk allowance. This results in Cody buying 1,000 shares of AAPL.
This sizing method can really up the position sizing and traders should understand the risks that you may not get executed at a price level equal to the stop price level or $102.00 which can result in substantial or significant losses. Reminder about thinly traded markets and overnight gaps. Trading liquid futures contracts can help alleviate some of this concern.
Build Alpha algo trading software supports this method with its “Volatility” based position sizing method. This is method is both dynamic and sizes based on the stop loss distance.
What is the Best Stop Loss Strategy? Optimizing various Stop Losses on different trading strategies
Enough with the discussion, let’s look at some data. We can test some specific stop loss strategies and see which one performs the best using Build Alpha. First a quick overview of stop types.
- Fixed Dollar Stop – risking the same dollar amount each trade regardless of the underlying price.
- Fixed Percentage Stop – risking the same percentage each trade or risking the same dollar amount and using the same fixed dollar amount to size your position. Both achieve the same.
- ATR based Stop – risking a multiple of ATR units away from the entry price. This is dynamic as the stop will widen or narrow as ATR fluctuates. For example, two ATR units below the long entry. If ATR is 0.44 then the stop would be 0.88 below the entry.
- Fixed Dollar Trailing Stop – risking the same dollar amount each trade but using a trailing stop instead of a fixed dollar stop.
- ATR based Trailing Stop – risking a multiple of ATR units but as a dynamic trailing stop.
For this test, we will choose three popular strategies, trade $10,000 per position, and backtest each strategy from 2006 to mid 2022. I will use the following stops in the test
- $100 Stop Loss (1% of position)
- $200 Stop Loss (2% of position)
- 1 ATR Stop Loss
- 2 ATR Stop Loss
- $100 Trailing Stop
- $200 Trailing Stop
- 1 ATR Trailing Stop
- 2 ATR Trailing Stop
The three automated trading strategies we will use are the following:
- The RSI20-80 strategy – Buy when the 2-period RSI crosses above 20 and sell when it falls below 80. Same strategy mentioned above.
- Turn Around Tuesday – buys stock index Tuesday after a down Monday which I first published here: Turnaround Tuesday: Wall Street Cliche Or Trading Edge? – See It Market
- Moving Average Crossover – we will buy when the 10-period SMA crosses the 50-period SMA. I will leave any moving average optimization up to the reader.
Here are the individual results sorted by strategy type

The $100 trailing stop was the best performer for both the RSI and Turnaround Tuesday strategy; however, it was one of the worst performers for the moving average crossover strategy!
This drives the point home that you must TEST EVERYTHING! There is no best and everything is relative to the strategy and symbols traded.
There are tons of other variations we could test such as combinations of stops, larger stops, smaller stops, etc. but that is the beauty of Build Alpha which allows you to quickly build and test strategies with no code. It is the first professional no code algo trading software available to all traders.

Need to Know about Stop Loss Orders
- Stop losses aim to protect traders from significant losses
- A Stop Loss is a sell order executed at a specified price to limit risk
- A Stop loss converts to a market order after the stop price is reached
- Stop limit order converts to a limit order after the stop price is reached
- Trailing stop adjusts every trade or every bar and trails the stop price in the favorable direction as the trade moves in the favorable direction and remains unchanged with unfavorable price movement
- Dynamic stops adjust to market volatility. Static stops are simpler to calculate.
- There is no best stop loss strategy. Each strategy requires individualized testing
Stop Loss Summary
Stop losses are a risk management tool in every trader’s toolbox. Stop losses and stop limit orders aim to limit risk and protect against significant losses. Trailing stops protect against initial losses and then improve to protect gains as the trade proceeds. Mean reversion strategies are often harmed by stop losses where trend following strategies are often improved. Finding the right stop loss vs stop limit and trailing stop strategy depends on the market, timeframe, and strategy type they are applied to. Having useful algo trading software like Build Alpha to run countless backtests and optimize price levels can help identify optimal stop loss strategies for any automated trading strategy.
Author

David Bergstrom – the guy behind Build Alpha. I have spent a decade-plus in the professional trading world working as a market maker and quantitative strategy developer at a high frequency trading firm with a Chicago Mercantile Exchange (CME) seat, consulting for Hedge Funds, Commodity Trading Advisors (CTAs), Family Offices and Registered Investment Advisors (RIAs). I am a self-taught programmer utilizing C++, C# and python with a statistics background specializing in data science, machine learning and trading strategy development. I have been featured on Chatwithtraders.com, Bettersystemtrader.com, Desiretotrade.com, Quantocracy, Traderlife.com, Seeitmarket.com, Benzinga, TradeStation, NinjaTrader and more. Most of my experience has led me to a series of repeatable processes to find, create, test and implement algorithmic trading ideas in a robust manner. Build Alpha is the culmination of this process from start to finish. Please reach out to me directly at any time.