Equity Curve Trading
What is an Equity Curve?
An equity curve is a plot showing the growth of capital over time from one specific trading strategy or portfolio. Said another way, an equity curve shows the cumulative profit of a trading strategy over time.
Algo traders look at equity curves as a first step in determining the viability of a trading strategy. For example, the equity curve below shows how an account would have performed had it traded only one contract using the fourth Free Friday strategy.
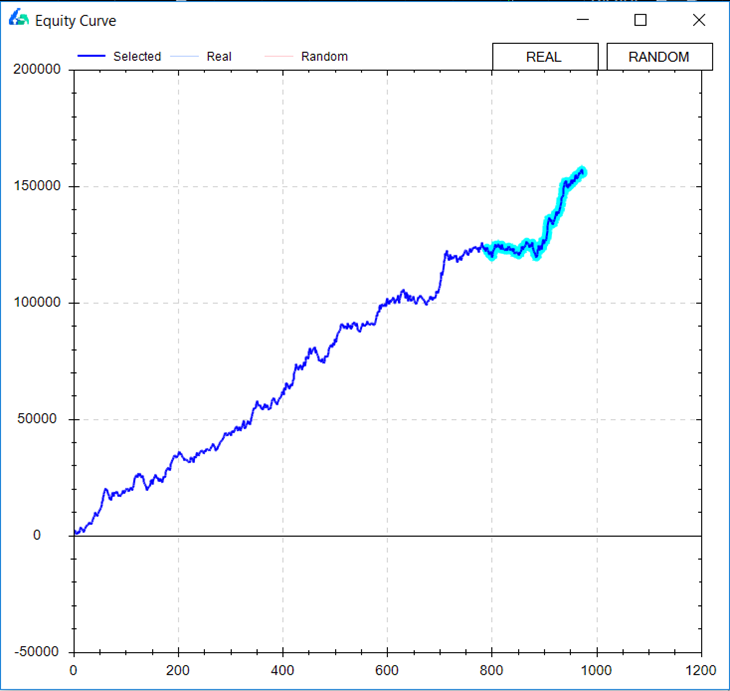
A rising equity curve warrants further investigation into a strategy’s robustness. Good strategies tend to move from the lower left to the upper right of the graph.
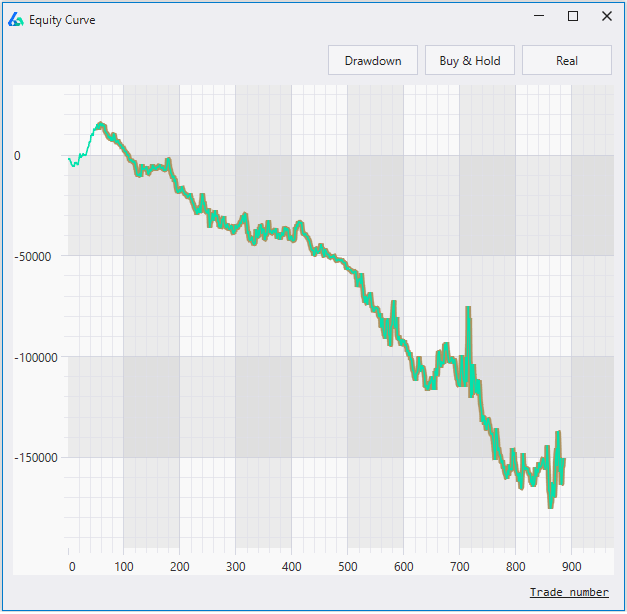
On the other hand, an equity curve with a negative return is moving in the opposite direction and most likely harmful for actual trading. A strategy like the one below can be discarded and does not need more of your time.
How to calculate an Equity Curve
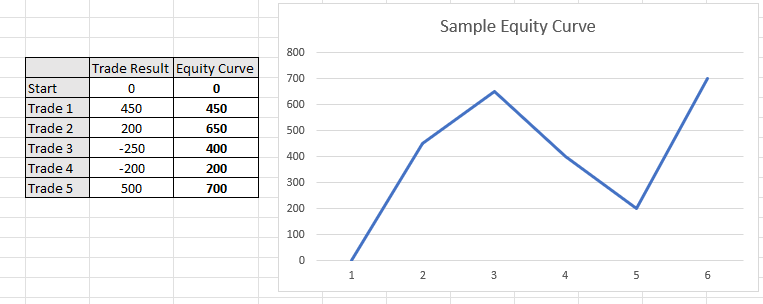
To calculate an equity curve we simply add each successive trade to the rolling sum. Assume a trading strategy made the following five trades: +450, +200, -250, -200, +500. To calculate the equity curve, we would simply add the trade results after each trade.
First, we have +450. Second, we have 450 + 200 or 650. Next, we have 650 – 250 or 400. Finishing this process results in the equity curve values +450, +650, +400, +200, +700.
What is Equity Curve Trading?
Equity curve trading, or managed equity curves, is using the equity curve of your trading strategy to make decisions about if you
- should or should not take your strategy’s next trade
- determine your next trade’s position size
- should adjust your money management
A major fear in system trading is that often times your profit and loss or “equity curve” is your only feedback loop. That is, you don’t know when to stop trading a “broken” system until it has already cost you significant money.
One industry idea is to monitor the equity curve in comparison to a moving average of the equity curve. That is, if our equity curve falls below its rolling average of the equity curve then maybe it is a red flag or early warning sign the system is broken. On the other hand, if you are confident in your system then maybe this temporary sign of system weakness is actually an opportunity to trade larger!
Below shows an example of applying this equity curve trading technique to your own strategy and using the moving averages of the equity curve to approve trading signals.
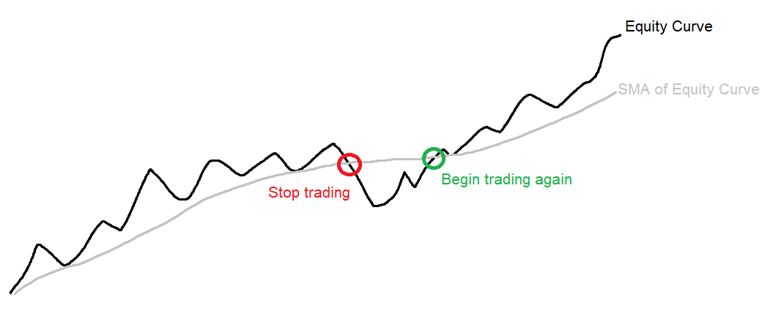
Some trading systems might miss significant drawdowns by simply turning off once the equity curve has weakened below its moving average and resume trading once the equity curve reclaims the moving average of the equity curve. The above example shows such.
Either way system traders need to know how their trading strategies perform when the equity curve weakens. If not, we are only to blame for our losses especially if we can identify some loss saving techniques ahead of taking a system live.
Equity Curve Trading Strategies
The trader should test various moving average parameter settings to find the best equity curve moving average to apply to each algo trading strategy. The most popular are the usual moving averages of lengths 5, 10 and 20 trades. Each strategy’s equity curve analysis will be different.
Most equity curve or performance-based systems can be defined as:
- Skipping trades when equity curve is above a moving average of equity
- Skipping trades when equity curve is below a moving average of equity
- Skipping trades after consecutive winning trades
- Skipping trades after consecutive losing trades
- Skipping based on net profit
- Skipping based on rolling Sharpe Ratio
Skipping or increasing size can be interchangeable. Optimizing moving average length or N trades for any of the above calculations can provide additional insights into improving trading strategies.
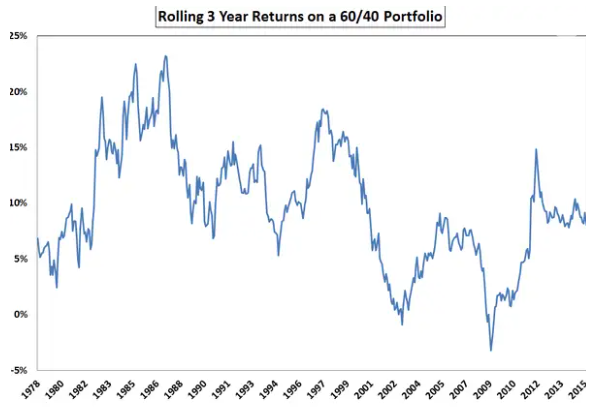
The autocorrelation of the trading strategy’s returns will determine if one should stop trading after the equity curve falls below its moving average or if one should increase size. If the strategy’s returns show strong negative autocorrelation, then the latter makes more sense.
Is my Strategy Working?
Many traders and small investors monitor raw equity curves to make a decision on a strategy’s health. If the strategy falls below its moving average does this mean the strategy is broken? A disciplined trader may be wise to evaluate the strategy once live trading net profit falls below the equity curve of the strategy.

However, wiser investment decisions based on strategy health and robustness are usually made using alternative stress tests. Equity curve strategies may reduce maximum drawdown but only where returns show serial correlation. That is, losses beget more losses and wins beget more wins.
For more on Strategy Health insights, please check out the Robustness Tests Strategy Guide.
Equity Curve Trading Software
Most brokerage platforms do not enable this type of functionality to execute equity curve trading. However, Build Alpha makes it simple to test any strategy for various equity curve trading strategies across all financial markets.
Build Alpha
In the picture below you can see the thicker blue line represents our original backtest’s equity curve. This is how the strategy has performed ignoring all equity curve fluctuations. The nasty drawdown that concluded around trade number 740 is not a drawdown most traders could endure.
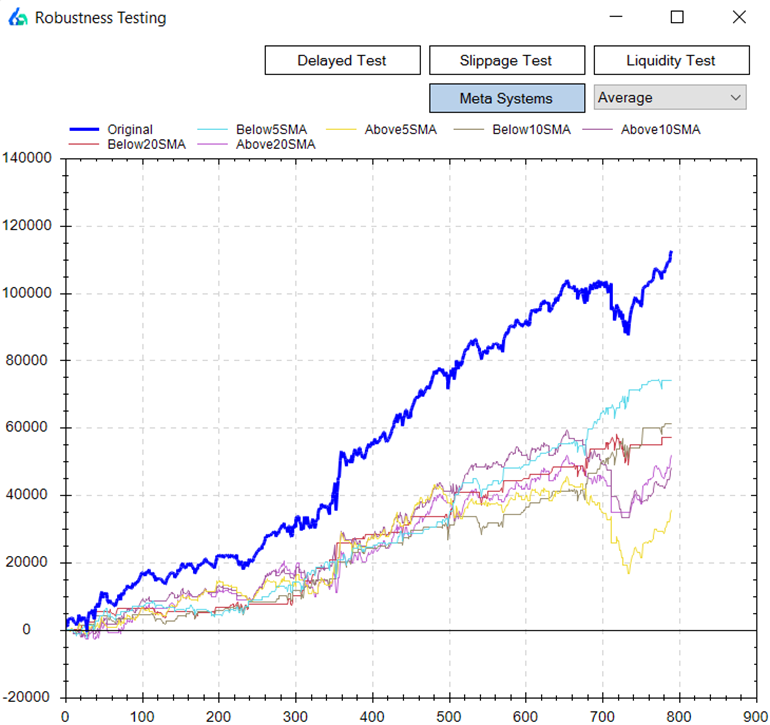
The baby blue line shows how the strategy performed only taking trades when the equity curve fell below its 5-period simple moving average. On the other hand, the yellow equity curve shows if you only took trades when the strategy’s equity curve was above its 5-period equity curve moving average.
You can see the baby blue returns are much smoother and avoided the most recent drawdown experienced around trade 740. In contrast, the yellow equity curve – only trading when the strategy was above its equity curve – caught all of the drawdown. In fact, the yellow equity curve had a worse drawdown than the original backtest.
Another Example
The blue and red lines show nice smooth returns whenever this strategy is below its 5 or 10 period equity curve moving average, respectively. On the flip side, the green and purple lines show how choppy and risky equity returns have been when only trading this strategy when above its 5 or 10 period equity curve moving average, respectively.

Need to Know
- Equity Curve Trading can be applied to any asset class: stock market, futures, forex trading and even crypto currencies.
- Equity Curve Trading can act as a money management technique and be applied to any used strategy.
- The original strategy can use technical analysis, technical indicators, fundamental analysis, alternative data, data mining, various currency pairs, etc.
- The most common equity curve trading strategy is comparing the cumulative profit of a trading strategy against a moving average of the cumulative profit. All things must be tested!
- Build Alpha enables traders to monitor strategy results and numerous equity curve trading techniques.
Summary of Equity Curve Trading Strategy
Equity curve trading can provide valuable information that temporary weakness in a particular strategy has historically been followed by large drawdowns or by periods of out-performance and strategy recovery.
This knowledge can give insights to the trader on when to increase position size/leverage or to just simply have confidence in periods of equity curve drops, for example.
The main takeaway being… often smoother returns or a better risk-adjusted return can be achieved by considering the strategy’s “health” vis-a-vis the equity curve in relation to a moving average of the equity curve.
Following an equity curve trading technique will produce a new equity curve.
Update – Meta Strategies
Equity curve trading can be considered a Meta Strategy. A Meta strategy is a trading strategy that trades an underlying trading strategy. The idea is to develop an overlay strategy that will improve an existing trading system. Ideally, these layered decisions will increase overall net profit and performance as opposed to just following the original strategy.
The simplest Meta Strategy is to only take a trade if the underlying or original trading system’s last trade was a loser. Obviously, we can get more complex and say only trade if the original trading system’s last three trades were winners or, more probable, do NOT trade if the original trading system’s last three traders were winners.
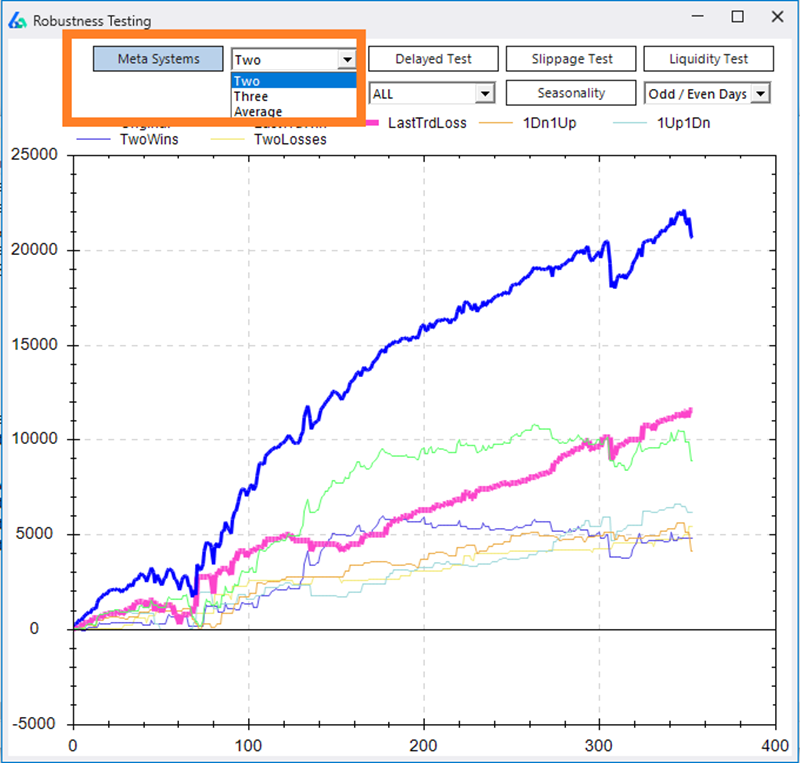
Build Alpha displays all the 2 and 3 trade meta strategy scenarios for each and every system. BA also shows equity curve trading results for every strategy.
Import Custom Strategies
A key feature of Build Alpha is the ability to import trading systems built outside Build Alpha and run all the robustness and curve fitting tests on them. For example, you could easily import your systems, view their equity curves, and check all these meta systems on all of your trading systems. This is far more helpful than learning a new technical analysis technique.
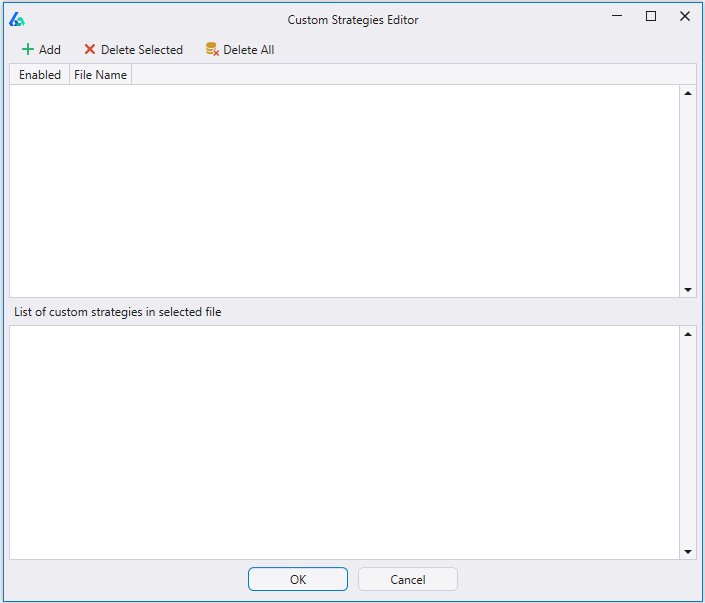
The image above is Build Alpha’s custom strategy import window.
Thanks for reading,
Dave
Learn more about Build Alpha and Equity Curve Trading
Contact me for the demo and watch how Build Alpha can easily demonstrate the best equity curve trading strategies for any trading inputs.
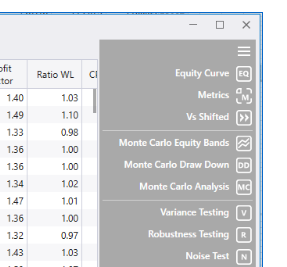
Locate the Robustness Testing Button
On the right-hand side of the results window, there is a button called ‘Robustness Testing’.
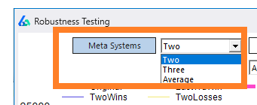
Change the Meta Systems view
Two displays all two trade scenarios such as: two consecutive wins, two consecutive losses, one win and one loss, one loss and one win, etc. Three displays all the three trade scenarios while Average displays moving averages of the equity curve trading.
Author
David Bergstrom – the guy behind Build Alpha. I have spent a decade-plus in the professional trading world working as a market maker and quantitative strategy developer at a high frequency trading firm with a Chicago Mercantile Exchange (CME) seat, consulting for Hedge Funds, Commodity Trading Advisors (CTAs), Family Offices and Registered Investment Advisors (RIAs). I am a self-taught programmer utilizing C++, C# and python with a statistics background specializing in data science, machine learning and trading strategy development. I have been featured on Chatwithtraders.com, Bettersystemtrader.com, Desiretotrade.com, Quantocracy, Traderlife.com, Seeitmarket.com, Benzinga, TradeStation, NinjaTrader and more. Most of my experience has led me to a series of repeatable processes to find, create, test and implement algorithmic trading ideas in a robust manner. Build Alpha is the culmination of this process from start to finish. Please reach out to me directly at any time.

Wow, this is super cool! Thanks for sharing.