Yes, you can backtest ICT and Smart Money Concepts. Fair Value Gaps, liquidity sweeps, and break of structure are geometric relationships between highs, lows, and closes. Anything you can describe that precisely can be tested.
Most descriptions of these concepts are vague enough to create a wide distribution of opinion. This article aims to put data to them while handing you a file that drops the signals straight into Build Alpha, and shows you the one bias that quietly ruins most SMC backtests before they start.
I get a lot of emails like "can Build Alpha do order blocks" or "have you tested ICT" so I finally sat down and looked at these concepts.
What follows is not an endorsement nor a takedown. I have no interest in either. My goal with Build Alpha has always been to give traders the power to test and validate their trading ideas.
What SMC and ICT Actually Are
ICT refers to the Inner Circle Trader material developed by Michael Huddleston. SMC, or Smart Money Concepts, is the broader label the community uses for the same family of ideas. In practice the two terms get used interchangeably, and the chart patterns underneath them are identical.
The popularity is not in dispute. Huddleston's YouTube channel is north of 1.8 million subscribers, the terminology has become the default vocabulary for a whole generation of retail futures and forex traders, and it is deeply embedded in the prop firm ecosystem. If you have spent any time in a trading Discord in the last five years you have seen order blocks, fair value gaps, and liquidity sweeps discussed as though they were settled science.
Here is the thing that struck me reading through it: the core concepts are more testable than most of what retail trading argues about. They are not sentiment. They are not "the market feels heavy." They are specific geometric relationships between bars. A fair value gap is three bars in a particular arrangement. A liquidity sweep is a low taken out and reclaimed. A break of structure is a swing point exceeded.
The Point This Article is Making
Nobody needs another opinion piece on whether ICT works. Once you write the rule(s) down exactly, specify the market and timeframe, and run it through a serious validation suite, we now have data. Trading and investing should always be a data driven process.
Where the ambiguity actually lives
When I started writing these signals, the discretionary descriptions kept falling apart on questions like:
- How big does a Fair Value Gap have to be? Every three-bar sequence with even a one-tick displacement technically qualifies. Nobody trades those. So there is an unstated size filter, and its value matters enormously.
- What counts as "filled"? A wick into the top of the gap? A close inside it? A full traverse to the far boundary? These are three different rules with three different equity curves.
- How far back does a level stay valid? Forever? Until the session ends? Until a newer one forms?
- How many bars define a swing point? Two on each side? Five? Twenty? This single parameter changes the entire character of a break of structure strategy.
None of these have canonical answers in the source material (that I found). That is not necessarily a criticism. In fact, these are the exact concepts I love to test. Hard enough the lay person won't do it. Easy enough to quantify.
The EventPrice Function: Memory for Price Levels
Almost every SMC concept has the same underlying shape: something happened in the past, it created a price level, and now we care about how current price relates to that level.
Standard indicator libraries are bad at this. They are built around rolling windows: the average of the last 20 bars, the highest high of the last 50. But "the high of the bar where the displacement started, whenever that was, however long ago" is not a rolling window. It is a memory.
That is what EventPrice is.
How EventPrice Works
Give it two things: a condition and a value.
Every bar where the condition is true, it stores the value, overwriting whatever it was holding. Every bar where the condition is false, it hands back the last thing it stored. That is the whole function.
Think of it as a sticky note. Something happens, you write a price on the note. The note sits there unchanged until the next time that something happens, at which point you cross it out and write the new price.
Once you have that, the entire SMC vocabulary opens up. An order block is a remembered candle body. A fair value gap is two remembered boundaries. A swept liquidity level is a remembered low. A break of structure level is a remembered swing high. They are all the same operation with different conditions.
Pair it with CountSinceEvent and you also get the "has this level been touched yet" logic that separates a fresh level from a stale one. That combination is what makes the three signals below possible.
Why This Matters Beyond SMC
EventPrice is not an SMC feature. It is a general-purpose primitive that happens to make SMC expressible. The same function stores the settlement price on the last CPI release, the VWAP anchor at a regime change, or the high of the bar where your own custom signal fired. See the feature engineering guide for more on building with event-anchored values in Build Alpha.
The translation table
Here is the mapping from SMC vocabulary to something a computer can evaluate. Everything in the right column is what actually gets tested.
| SMC Term | What It Means | Testable Expression |
|---|---|---|
| Fair Value Gap | Three-bar sequence leaving an untraded price range | Low[0] > High[2] |
| Gap boundaries | The top and bottom of that untraded range | EventPrice(FVG, Low[0]) / EventPrice(FVG, High[2]) |
| Liquidity sweep | Prior low taken out and reclaimed same bar | Low < PriorLow and Close > PriorLow |
| Swing high | Bar higher than N bars either side of it | High[N] = Highest(High, 2N+1) |
| Break of structure | Close above a confirmed swing high | Close > EventPrice(SwingHigh, High[N]) |
| Unmitigated level | Level not yet traded back to | CountSinceEvent(level formed, touch) = 0 |
| Displacement | The move was large enough to matter | Range > k * ATR(14) |
Note the last row. Every size threshold in these signals is expressed as a multiple of ATR rather than a fixed number of ticks or pips. This is not a stylistic preference. A 10-tick gap in ES in 2017 and a 10-tick gap in ES in 2020 are completely different events. If you hard-code point values, your rule silently changes meaning as volatility regimes shift, and your backtest is measuring the volatility regime rather than the pattern. Normalizing by ATR keeps the definition stable across markets and across decades.
Fair Value Gap
A bullish Fair Value Gap is a three-bar pattern where the low of the most recent bar sits above the high from two bars ago, leaving a band of prices that never traded during the sequence. The idea in the SMC literature is that this untraded band represents an inefficiency, and price has some tendency to return to it before continuing.
The gap spans from High[2] at the bottom to Low[0] at the top. After the pattern completes, price is sitting above the entire zone. The trade is a pullback into it.
Reminder: [0] denotes the current bar or where we'd evaluate the signal from. [2] denotes two bars ago.

The Conditions
- A bullish FVG exists.
Low[0] > High[2]. Both boundaries get stored with EventPrice the moment the pattern completes. - Price is above the bottom of the gap. The setup is only live while price remains above the lower boundary. Below that, the gap is invalidated rather than filled.
- The gap has not already been filled. Since the gap formed, price has not traded down through the fill level. This is what separates a fresh gap from one that has already done its job.
- The gap is big enough to matter.
(Low[0] - High[2]) > k * ATR(14). Without this you are trading every one-tick imperfection on the chart.
The Entry
- Buy on limit at the fill level. The order rests inside the gap and only executes if price actually comes back to it. No chasing, no market orders into a moving tape. If price never returns, no trade happens, which is exactly what should happen. I tested the exact level but of course worth testing variations.
Variations worth testing
Bullish Liquidity Sweep
The premise: stop orders cluster below obvious lows. Price dips beneath the low, triggers those stops, and then reverses. In SMC language the low gets "swept" and the move down was "engineered" to access liquidity.
You do not need to accept the causal story to test the pattern. The pattern itself is simple and unambiguous: price trades below a prior low and closes back above it. Whether that happens because of stop hunting, mean reversion, or ordinary intraday noise is a separate question from whether it is tradeable.

The Conditions
- Price trades below the prior low.
Low < Lowest(Low, N)[1]. The reference level is the lowest low of the previous N bars, captured before the current bar. - Price closes back above it.
Close > Lowest(Low, N)[1]. This is the reclaim. Without it you have a breakdown, not a sweep. - The sweep was meaningful.
(SweptLevel - Low) > k * ATR(14). A one-tick poke and a half-ATR flush are different events. The threshold decides which one you are studying.
The Entry
- Buy the next bar's open. The simplest possible execution assumption, and deliberately so. When you are evaluating whether a pattern has any signal in it at all, you want the entry logic to add as little as possible. If the edge only appears with a clever entry, the edge is probably in the entry rather than the pattern.
Variations worth testing
Break of Structure
Break of structure is the momentum member of the family. A swing high forms, price later exceeds it, and that exceedance is read as confirmation that the trend has continued rather than reversed.
Defining the swing high is where all the difficulty sits. The standard definition is a fractal pivot: a bar whose high exceeds the highs of the N bars before it and the N bars after it.

Read that again, because there is a trap in it, and it is the single most important paragraph in this article.
The Trap: A Swing High Does Not Exist When It Forms
If a swing high requires N bars on each side, then you cannot know it is a swing high until N bars after it printed. On a chart it looks like the level was there all along, because charts are drawn after the fact.
An enormous number of SMC indicators draw the level at the pivot bar itself. Backtests built on those indicators are using information that did not exist at the time of the trade. They produce beautiful equity curves and they fail immediately in live trading.
Any honest implementation delays confirmation by N bars. The level becomes tradeable N bars after the pivot, not at the pivot. This is not a detail. It is the difference between research and fiction.
The Conditions
- A swing high is confirmed.
High[N]is the highest of the surrounding2N+1bars. Evaluated at the current bar, which means it refers to a pivot that happened N bars ago. Store it with EventPrice. - The level has not already been breached. Since confirmation, price has not exceeded it. This restricts you to the first break. A level that has been chewed through three times is not the same object as a fresh one.
- Optional: require displacement. The break should carry some size relative to ATR, otherwise you are trading a level that price is grinding sideways through.
The Entry
- Buy on stop at the swing high. The order rests above the level and triggers on the break itself. This is the honest execution for a breakout: you are filled at the level, in the direction of the move, with no assumption that you saw the break before anyone else did.
Variations worth testing
Testing Is Not the Same as Validating
Here is where I have to be direct, because this is the part that determines whether any of this is useful to you.
Running one backtest on a Fair Value Gap strategy and seeing a profitable equity curve tells you almost nothing.
Think about how many decisions went into producing that curve. The gap size threshold. The fill definition. The market. The timeframe. The entry order type. The stop and target. The session filter. Each one is a knob, and you turned every one of them before you saw the result. With that many degrees of freedom, finding a profitable configuration is close to guaranteed even in data with no edge in it whatsoever. This principle is well-established in quantitative finance research, as documented in academic studies on machine learning in trading and professional backtesting methodologies used by hedge funds.
This is not a hypothetical concern. It is the default outcome. Research from trading system robustness analysis confirms this pattern repeatedly. Which is why the interesting work starts after the backtest, not at it.
Vs Random compares your strategy against random entries with the same trade count and holding period. If an FVG entry cannot beat a coin flip with matched trade characteristics, the pattern is not doing the work. Noise Test perturbs the underlying data slightly and re-runs. A rule that only works on the exact price path you happened to get is not a rule. Monte Carlo Permutation Test estimates how often a result this good appears under the null hypothesis of no edge, which converts your backtest into something resembling a p-value. Walk Forward checks whether parameters chosen on past data hold up on data they never saw. These methodologies are standard in professional trading platform validation and quantitative finance.
See the robustness test suite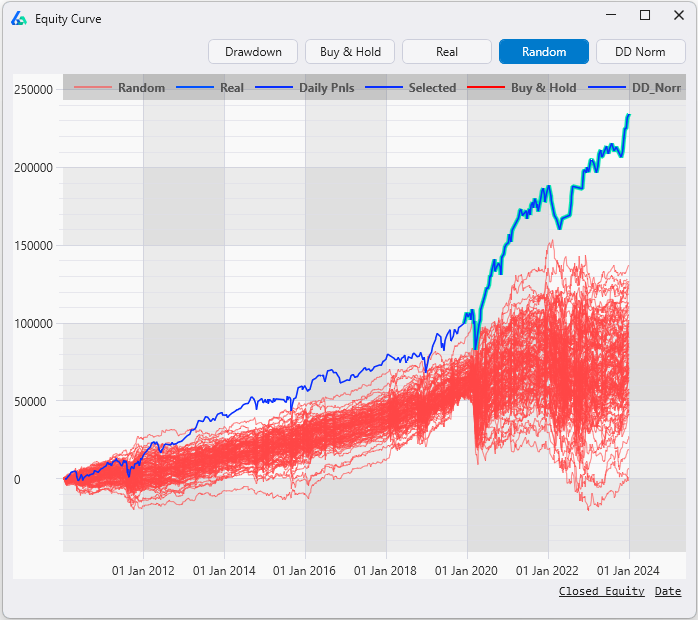
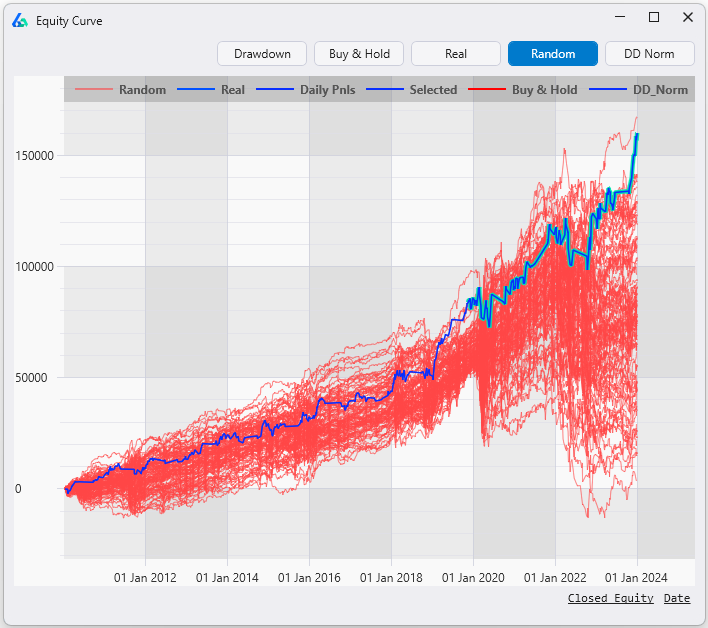
My honest position, stated plainly: I am not telling you these concepts work and I am not telling you they do not. I am telling you that the question is answerable, that answering it takes about twenty minutes now instead of a weekend of coding, and that the answer will be specific to a market, a timeframe, and a precise rule set rather than to "ICT" as a category.
Some of these configurations will survive the suite. Most will not. That ratio is not special to SMC, incidentally. It is the ratio for every idea anyone has ever tested, including mine. The value is not in the concepts being good or bad. The value is in no longer having to guess.
Download the Signal File
I built all these signals already. Rather than describe them and leave you to reconstruct the logic, I am just giving you the file.
Fair Value Gap, bullish liquidity sweep, and break of structure, plus their variations. Lookahead-safe, ATR-normalized, and ready to run on any market with OHLC data.
- Download the file using the button below.
- Drop it into your Build Alpha folder.
- The signals appear in your signal list alongside the built-ins.
- Select them, pick a market and timeframe, and run a simulation.
The signals export like any other Build Alpha signal, which means whatever you build with them generates ready-to-run code for TradeStation, NinjaTrader, MultiCharts, MetaTrader 4 and 5, TradingView, IBKR Python, and ProRealTime.
The AI Assistant Knows These Now Too
The other half of this: I fed these definitions into Build Alpha's signal catalog, which is what the connected LLM reads when you ask it to build something.
Practically, that means the AI assistant now has worked examples of SMC-style logic to pattern-match against. You can describe a variation in plain English and it will draft the signal for you.
"Build me a bearish fair value gap that only forms during the first two hours of the session, requires the gap to be at least half an ATR, and invalidates if price closes above the top of the gap."
That goes in. A working, exportable signal definition comes out, validated through the same pipeline as every built-in signal, and available in your Custom Indicators Editor. More on how that works in the LLM Orchestrator guide.
Which brings me to the thing I actually find remarkable about all this.
I taught myself to code out of textbooks so I could test ideas like these. That took years, and for a long time the barrier to entry in systematic trading was mostly a programming barrier rather than a thinking barrier. Plenty of people with good instincts about markets never got to find out whether their instincts were right, because the distance between the idea and the test was too far.
That distance is now roughly a sentence or a few clicks. Closing this gap has always been my mission with Build Alpha.
As always, thanks for reading.
David

David Bergstrom
A decade-plus in professional trading as a market maker and quantitative strategy developer at a high-frequency trading firm with a CME seat. Consulting for hedge funds, CTAs, family offices, and RIAs. Self-taught C++, C#, and Python programmer specializing in data science, machine learning, and trading strategy development.
Frequently Asked Questions
Can you backtest ICT and Smart Money Concepts?
Yes, as long as you are willing to write the concept as a precise rule. Fair Value Gaps, liquidity sweeps, and break of structure are all geometric relationships between highs, lows, and closes, which means they can be expressed as conditions and tested. The difficulty is not the testing. The difficulty is that most published descriptions of these concepts are ambiguous enough to support several different rule sets, and those rule sets do not all produce the same results.
What is a Fair Value Gap and how do you define it for a backtest?
A bullish Fair Value Gap is a three-bar pattern where the low of the third bar is above the high of the first bar, leaving an untraded price range in between. For a backtest you need four things the discretionary description leaves out: the exact gap boundaries, whether price is above or inside the gap, whether the gap has already been filled since it formed, and a minimum gap size so you are not trading noise. Once those are specified the pattern is fully testable.
Does ICT trading actually work?
That is the wrong question to ask in the abstract, because ICT is a vocabulary rather than a single strategy. A Fair Value Gap entry on 5-minute ES with a 0.5 ATR minimum gap size is a different thing from a Fair Value Gap entry on daily EURUSD with no size filter, and they can produce opposite results. The honest answer is that individual, precisely specified SMC rules can be tested on specific markets and timeframes, and some survive validation while many do not. Test the rule you actually intend to trade rather than the concept in general.
Do ICT indicators repaint?
Many do, particularly ones based on swing highs and swing lows. A swing high defined as a bar higher than the N bars before it and the N bars after it cannot be confirmed until N bars have passed. Indicators that draw the level at the swing bar itself are showing you information that was not available at the time. Backtests built on that logic will look excellent and fail live. Any correct implementation must delay confirmation by N bars, which is how the signals in the downloadable file are built.
What is the EventPrice function in Build Alpha?
EventPrice takes a condition and a value. Whenever the condition is true it stores the value. On every other bar it hands back whatever it stored last. It is a memory cell for price levels, which is exactly what Smart Money Concepts need, because almost every SMC idea is a comparison between current price and a level created by an event in the past.
What is the difference between SMC and ICT?
ICT refers to the Inner Circle Trader material developed by Michael Huddleston. SMC, or Smart Money Concepts, is the broader label the wider community uses for the same family of ideas: order blocks, fair value gaps, liquidity sweeps, market structure shifts, and session-based timing. In practice the terms are used interchangeably and the underlying chart patterns are the same.
Do I need to know how to code to test these signals?
No. The signals in the downloadable file are already built. You import the file, select the signals, and run a simulation. If you want to modify them or build new SMC variations, Build Alpha's AI assistant now has these definitions in its signal catalog, so you can describe the variation in plain English and it will draft the signal for you.
Which markets and timeframes do these SMC signals work on?
The signal definitions are market-agnostic and run anywhere you have OHLC data, including futures, forex, equities, ETFs, and crypto. Whether the resulting strategies hold up is a separate question and is exactly what the robustness suite is for. Because the size thresholds are expressed in ATR terms rather than fixed points, the same definition remains meaningful across instruments and volatility regimes.
Is one profitable backtest enough to trade an SMC rule?
No. A single profitable backtest is the weakest possible evidence, especially on a pattern with several tunable parameters. Run the strategy against Vs Random to see whether it beats random entries with the same trade profile, the Noise Test to see whether it survives small perturbations in the data, and a Monte Carlo Permutation Test to estimate how likely the result is under the null hypothesis of no edge.