Features
Every Tool a Systematic Trader Needs
Intelligent strategy creation, 12+ institutional-grade robustness tests, one-click code generation, portfolio simulations, live monitoring and alternative data — all point and click.
Strategy Building
Build Strategies Your Way
Select from 7,000+ signals, define entries, exits, risk management, and let the genetic algorithm search millions of combinations.
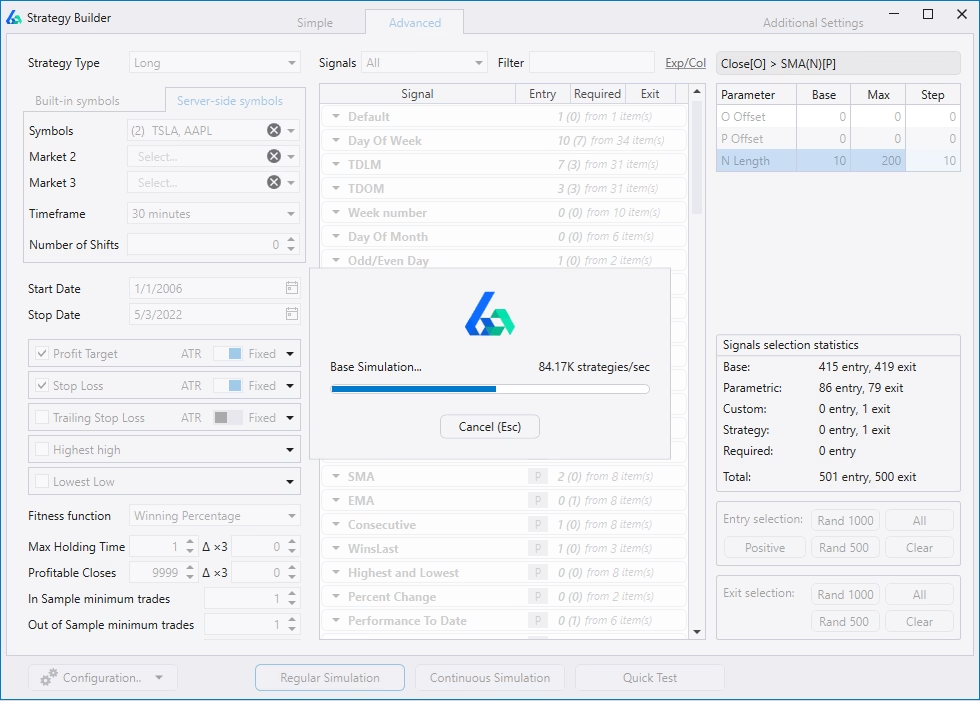
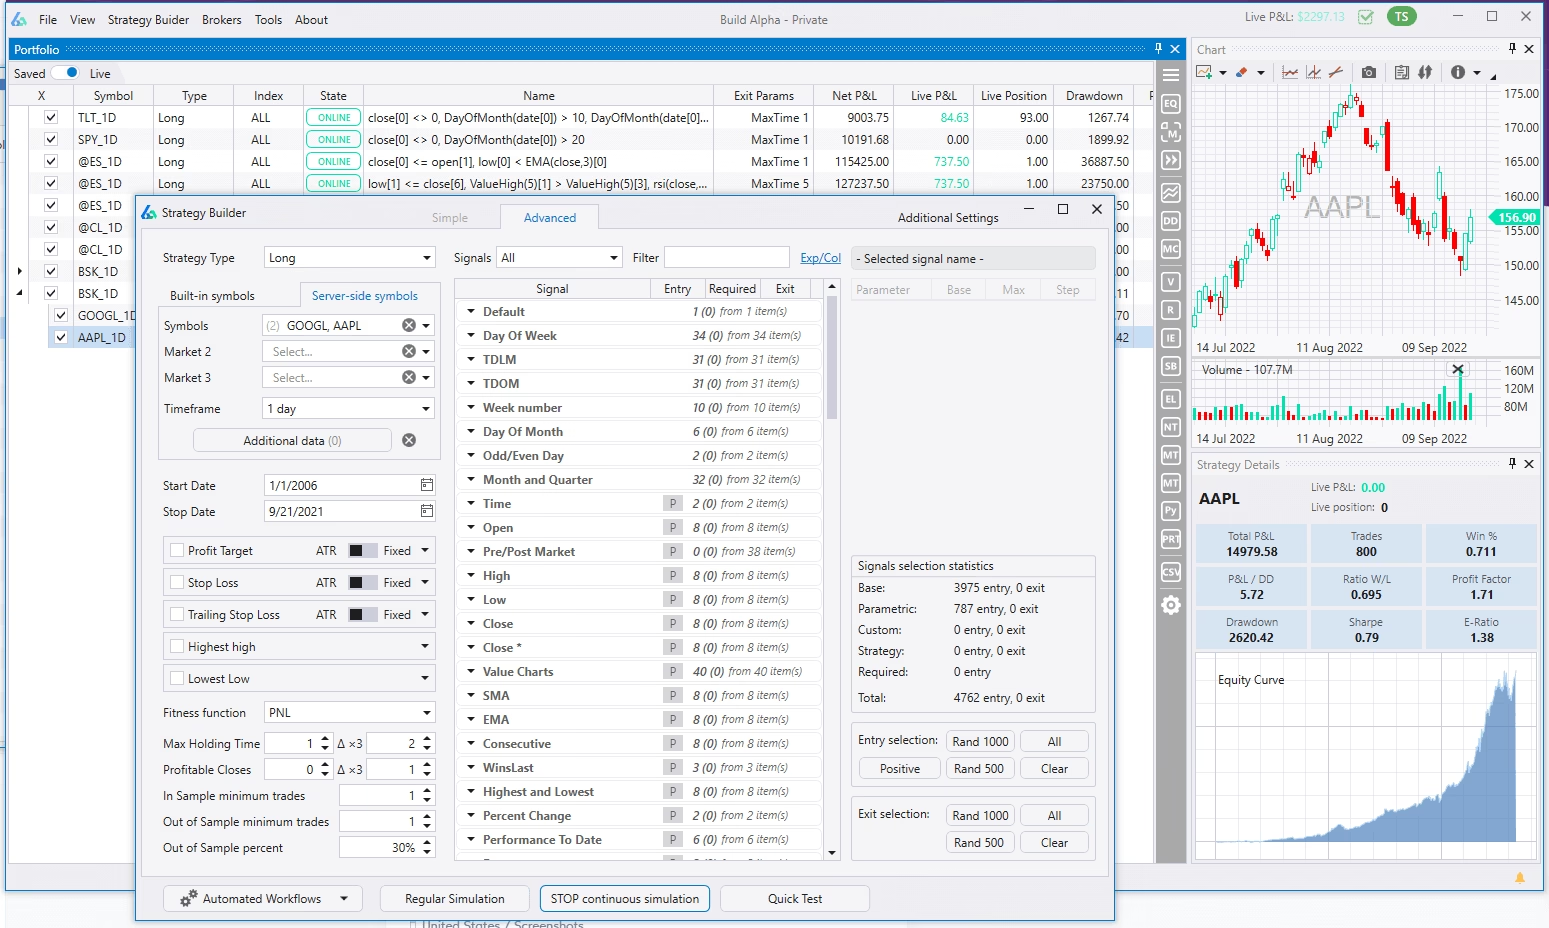
Input Interface
Select symbols, dates, timeframe, entries, exits, risk management, parameter settings, fitness function. Choose from 2 signals to all 7,000+ at once, then hit Simulate.
Automated Workflows
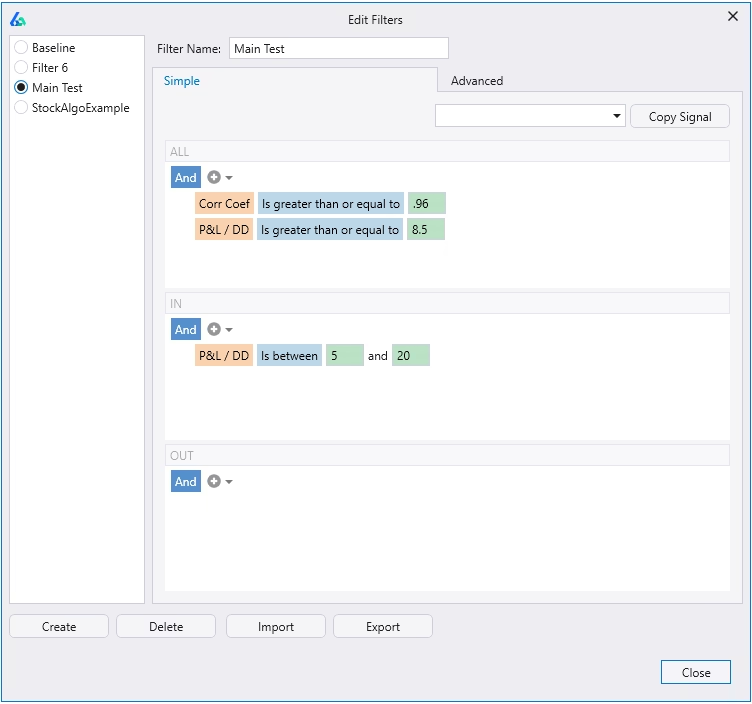
Set automatic filters on performance metrics, trade counts, and robustness test results. Only view strategies that pass your exact criteria — an enormous time saver.
Set IS, OOS, or combined filters. Require the Noise Test to be positive, the Variance Test within x% of backtest, minimum profit factor, minimum win %, minimum trades, and more — all before viewing a single result.
NEW
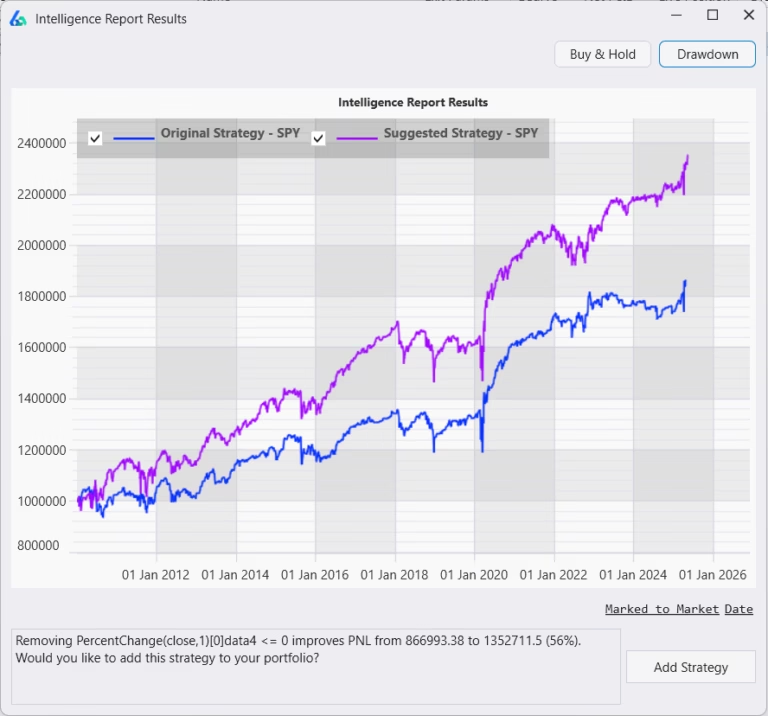
Intelligence Report
Build Alpha reviews all your saved strategies and automatically suggests improvements. Run the IR and click any strategy’s icon to view the suggested modification.
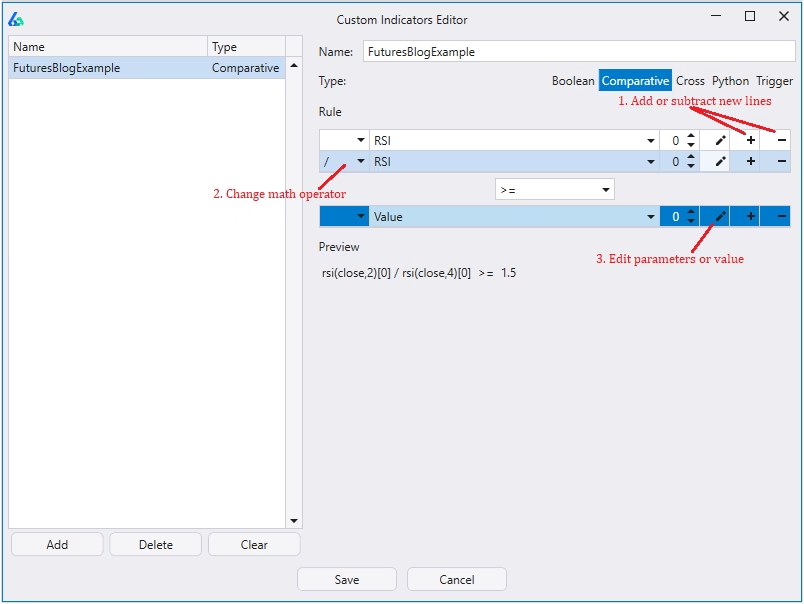
Create Custom Signals
Over 7,000 signals built-in. Add your own via the drag-and-drop editor or a fully capable Python environment. All custom signals combine with any built-in signal.
The Differentiator
12+ Institutional-level Robustness Tests
Any software can find a strategy that looks good in hindsight. Only Build Alpha tells you if it’s real. Every test below is designed to filter out curve-fit, fragile strategies before you risk a single dollar.
Vs. Random
Noise Test
Variance Test
Monte Carlo
Across Markets
Delayed Entry/Exit
Out of Sample
Edge Ratio
Randomized OOS
Walk Forward
Intraday Checks
Param. Permutation
Deep Dive: Each Test Explained
Core Test
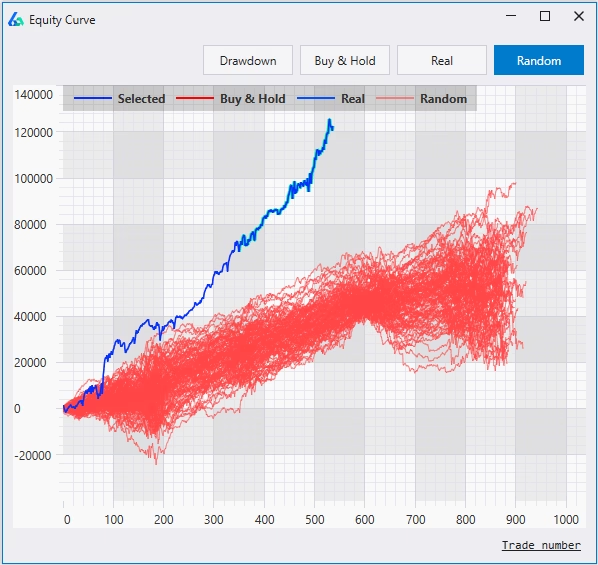
Vs. Random
Compare generated strategies against strategies built from completely random signals. If your strategy can’t meaningfully outperform random, it has no real edge — it’s curve-fit noise.
The dark blue line is your strategy. Blue lines are the top 100 real strategies. Red lines are random strategies. The difference should be obvious and large.
Core Test
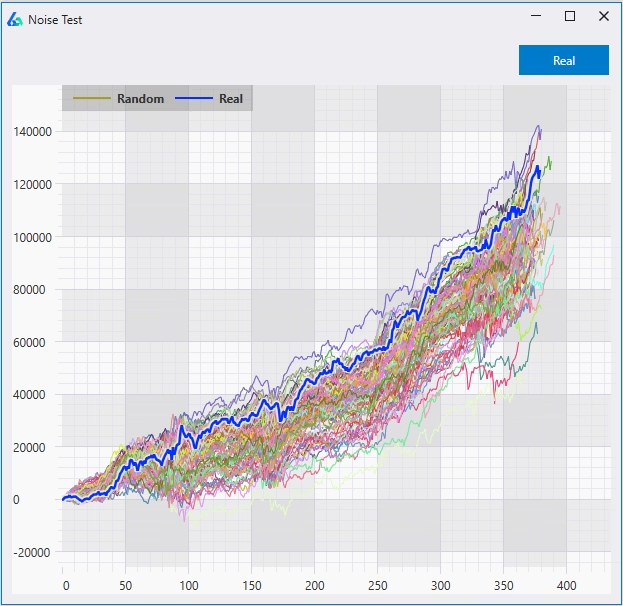
Noise Test
Creates 1,000 synthetic price series with altered noise (volatility) and re-trades the strategy on each one. If changing the noise breaks the strategy, it was fitted to volatility artifacts — not a real signal.
You have full control over how the noise-adjusted data series are created. This test alone eliminates a huge percentage of would-be “winning” strategies.
Core Test
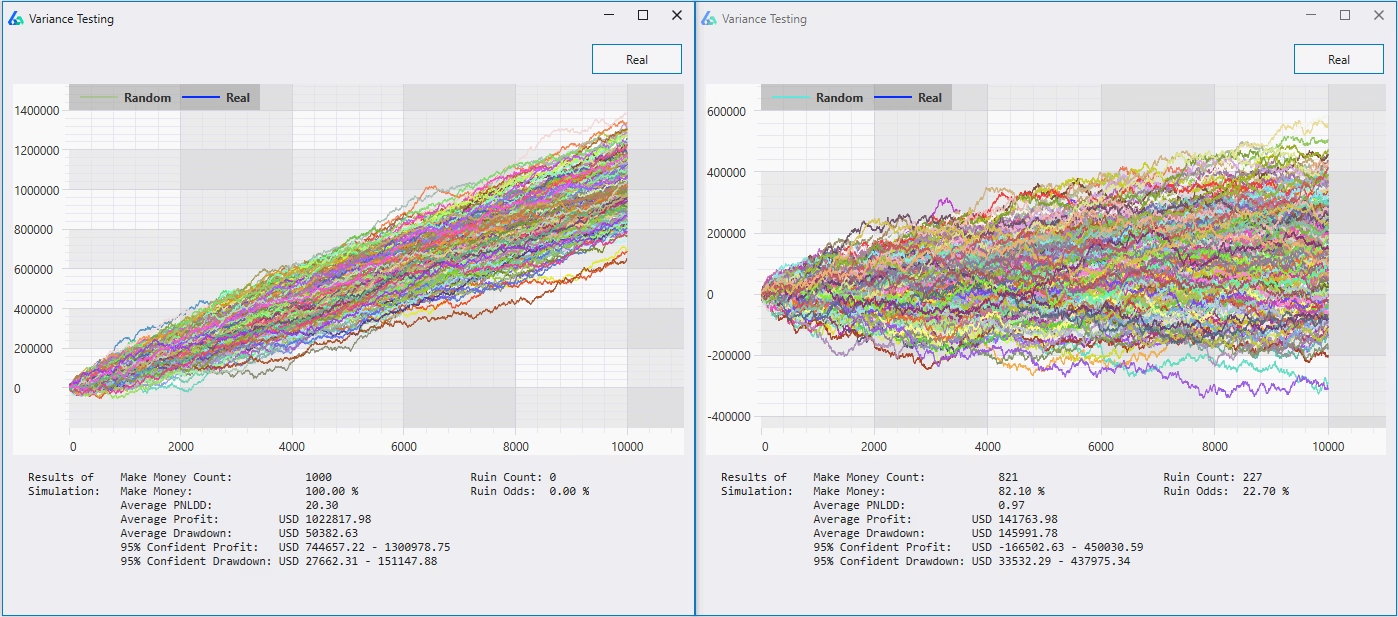
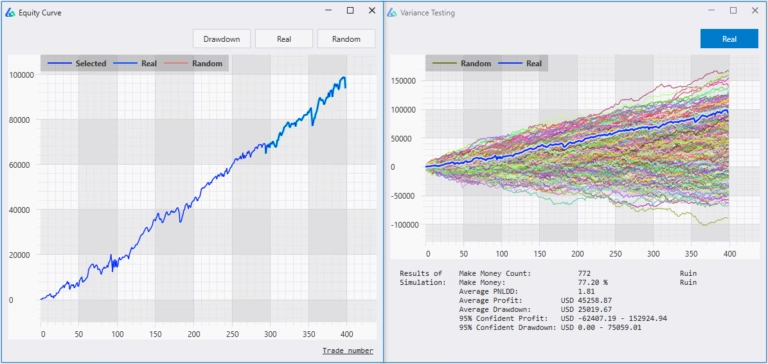
Variance Testing
A unique forward simulator. It creates hypothetical equity curves into the future based on the backtest’s distribution of returns — with varying win rates. See how likely a strategy is to make $X or lose $X over the next N trades.
Outputs: probability of profit, probability of hitting a drawdown, average profit/drawdown over simulations, and 95% confidence intervals. This is how you prevent “all my systems fail when they go live.”
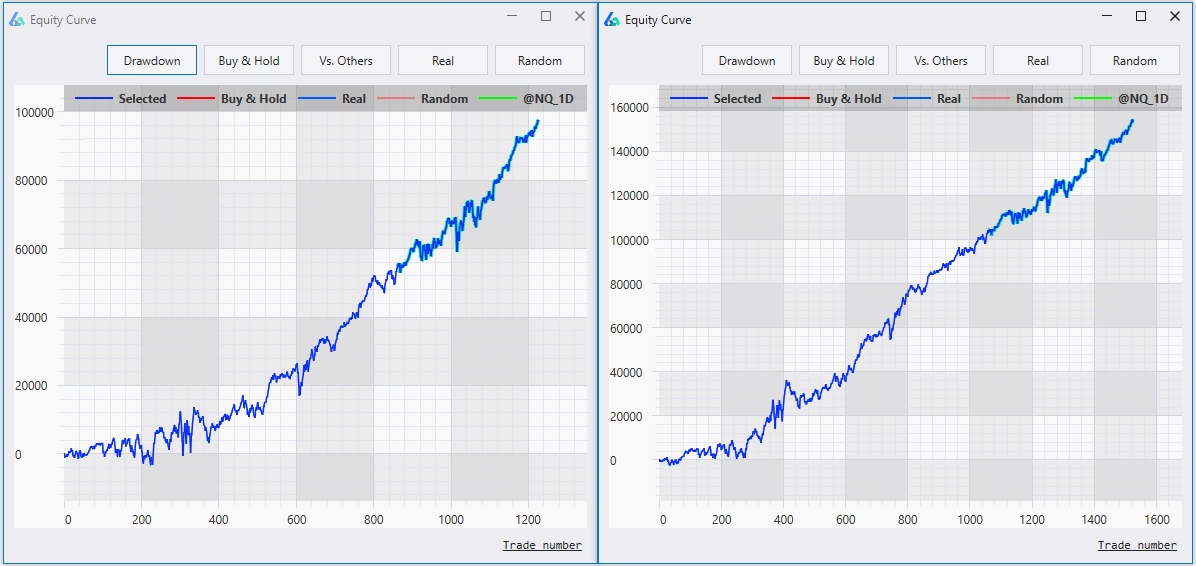
Case Study
When a Backtest Lies
The left chart and right chart show the same backtest. Alone, it looks like a viable strategy. After Variance Testing, the average profit from simulation was only $45,000 — or 45% of the backtest’s $100,000.
Expecting $100K in the next 400 trades is highly unlikely. Without this test, you’d have deployed capital based on a fantasy. This is why Variance Testing exists.
Core Test
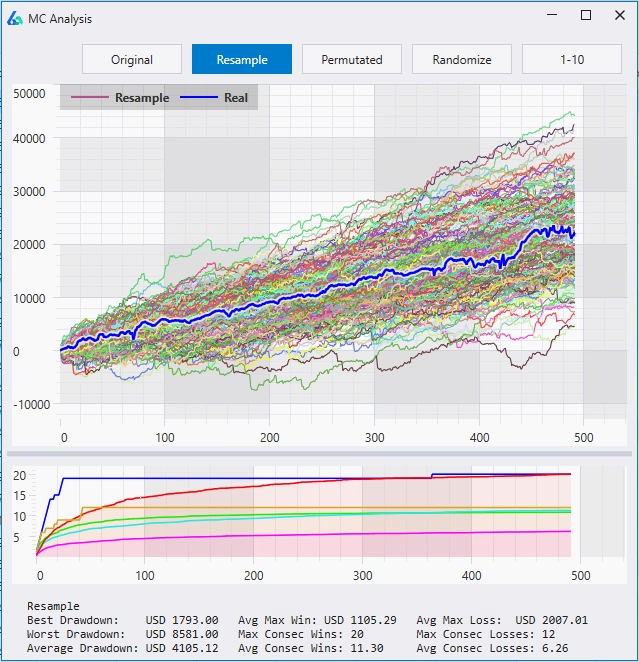
Monte Carlo Simulation
Reshuffles trade order 1,000+ times to identify realistic performance paths and drawdown expectations. View best, worst, and average drawdown across all simulations before risking real capital.
Adjustable confidence intervals, trade count, and number of simulations. Red projection bands on the equity curve serve as a live threshold — if performance breaks below the band, the strategy warrants reevaluation.
Across Markets
Test strategies across additional markets, timeframes, and asset classes. If an S&P 500 strategy falls apart on the Nasdaq or DAX, it’s likely overfit to one dataset.
A major fear of system trading is overfitting. This is the simplest and most intuitive check — and Build Alpha makes it one click.
Core Test
Out-of-Sample Testing
Build Alpha’s first line of defense. Historical data is separated into an in-sample period and an out-of-sample period. Strategies are built and optimized on in-sample data, then tested on the unseen out-of-sample data.
If performance looks consistent across both periods, confidence increases that the strategy generalizes to new, live data. The blue line shows in-sample; the highlighted portion is out-of-sample.
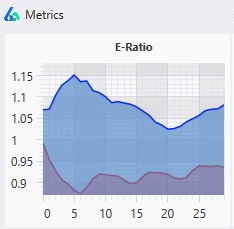
Edge Ratio (E-Ratio)
Measures how much a trade goes in your favor vs. against you at each step in time after entry. A higher value means more edge; when it decays to baseline, it’s time to exit.
Blue line = your strategy. Red line = best random strategy (baseline to beat). Strategies with E-Ratio below the red baseline are less likely to survive live trading.
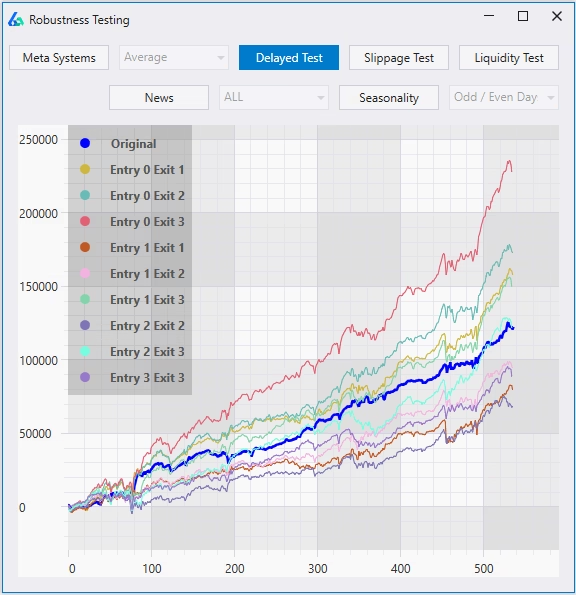
Delayed Entries & Exits
Lag entries and exits by N bars and check if the strategy remains profitable. Robust strategies tolerate imperfect timing. This one actually improved with a 3-bar exit lag.
Simple but often overlooked. If a strategy breaks when you shift entry by one bar, it’s too fragile for live trading.
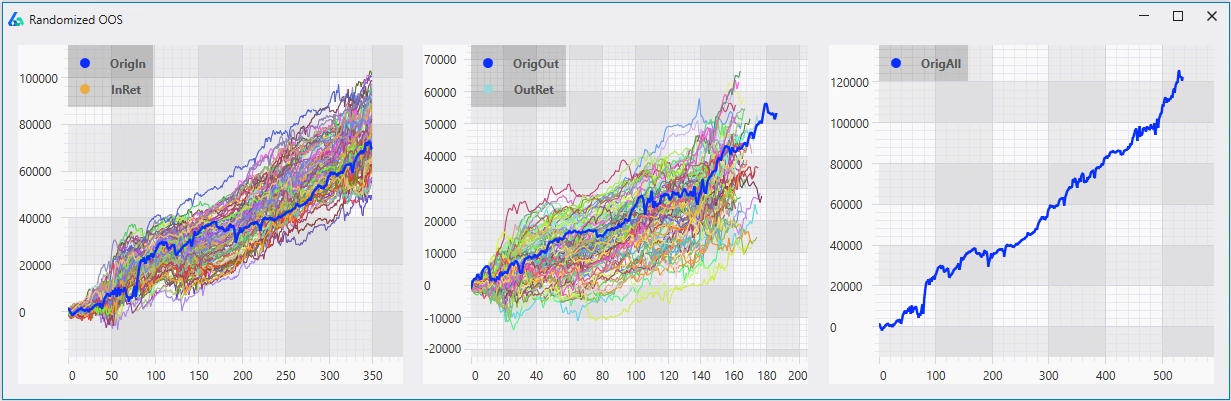
Randomized Out-of-Sample
Standard OOS can be passed when the OOS period has a strong trend. This test runs 1,000 iterations with random, non-continuous data points as OOS, ensuring a lucky trend didn’t inflate results.
View a distribution of OOS outcomes instead of relying on a single backtest period.
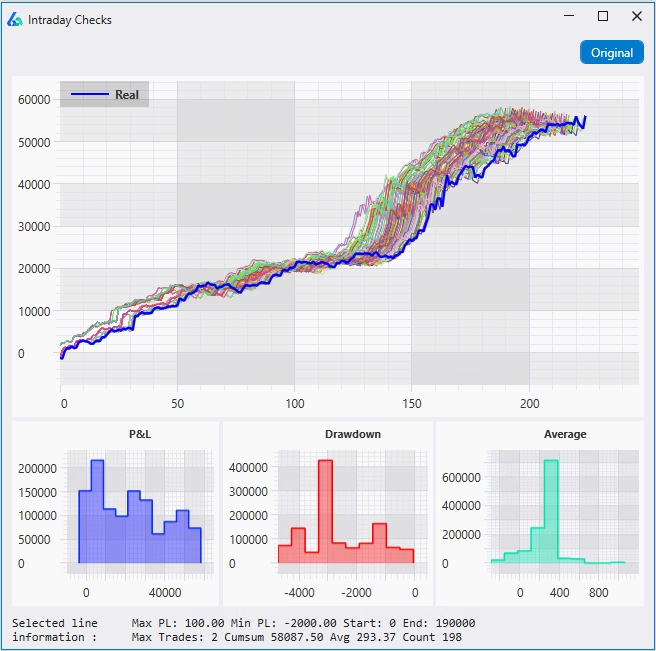
Intraday Checks
Optimize ideal times of day to trade, max/min P&L per day, and total trades per day. Distribution plots for total P&L, drawdown, and average trade help you avoid trading lucky outliers.
Core Test
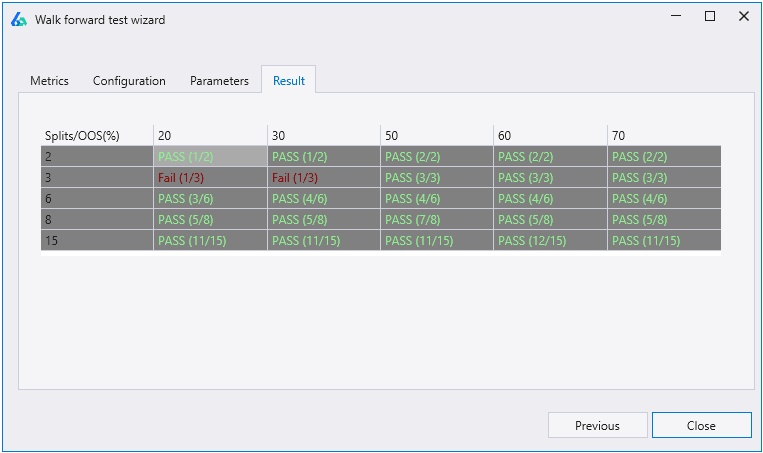
Walk Forward Optimization
Splits historical data into multiple rolling training and testing windows. Optimize parameters on in-sample data (blue), then test on unseen out-of-sample data (green). Repeat until you’ve “walked forward” through the entire dataset.
Build Alpha’s Walk Forward Matrix runs all combinations of run counts and OOS percentages automatically, showing pass/fail rates at each setting. If optimal parameters fluctuate wildly between periods, the strategy is likely curve-fit.
Core Test
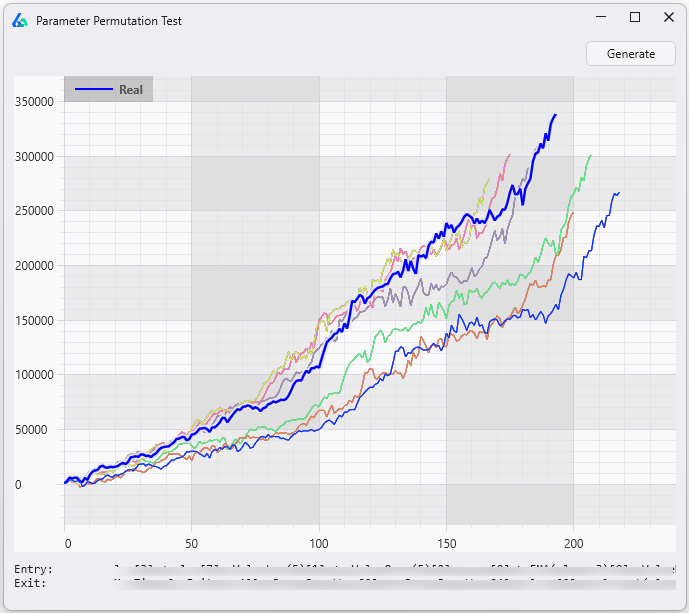
Parameter Permutation Testing
Tests whether your strategy’s performance is genuinely robust or an artifact of a single lucky parameter set. Build Alpha systematically permutes parameter values across thousands of combinations to map the full performance landscape.
If only a narrow sliver of parameter space is profitable, the strategy is fragile. If a broad region of parameter space shows consistent results, the strategy has real structural edge — not just optimized noise.
Results
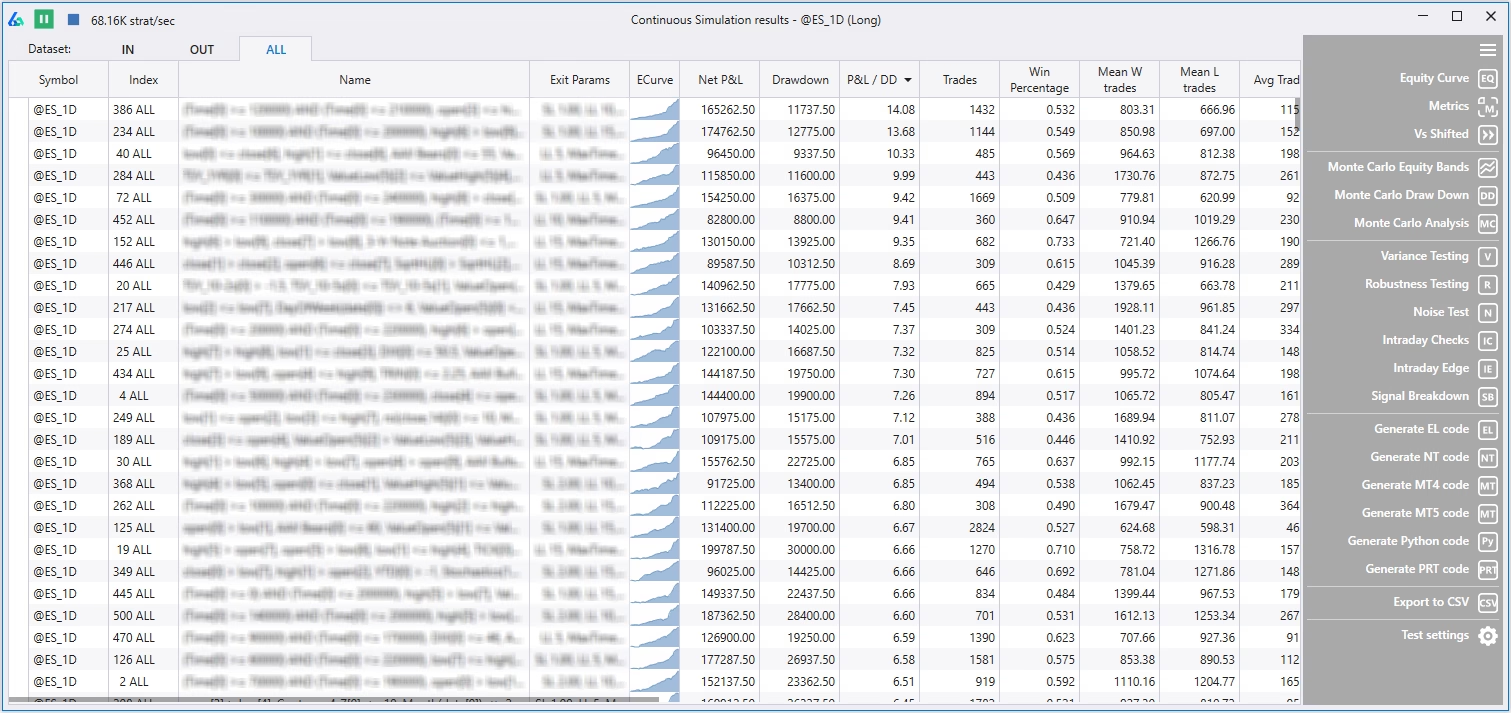
Output & Visualization
Sift through hundreds of generated strategies. View equity curves, Monte Carlo projections, and performance metrics — all sortable and filterable.
Output Interface
Navigate IS, OOS, and combined results with arrow keys. Every strategy’s signals, profit factor, win %, net P&L, drawdown, Sharpe, and trade count in a sortable table.
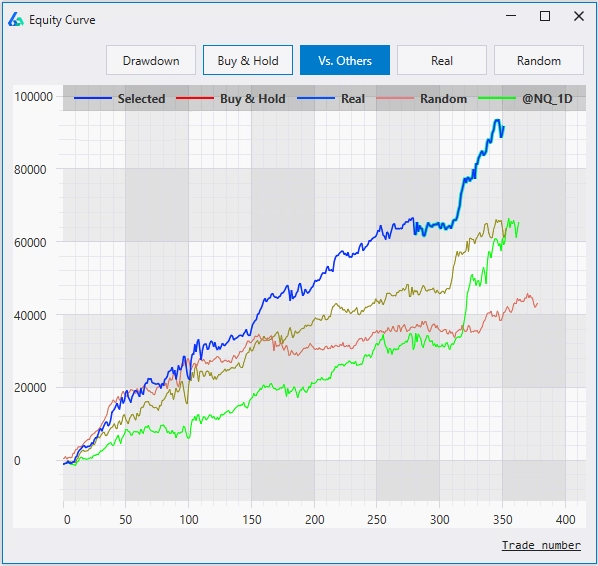
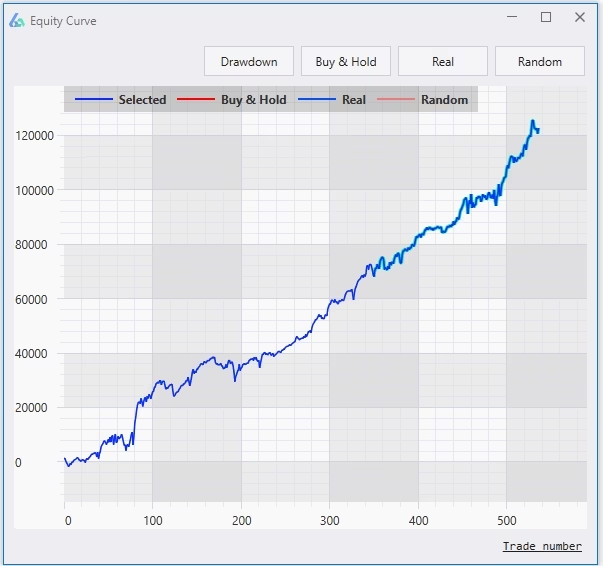
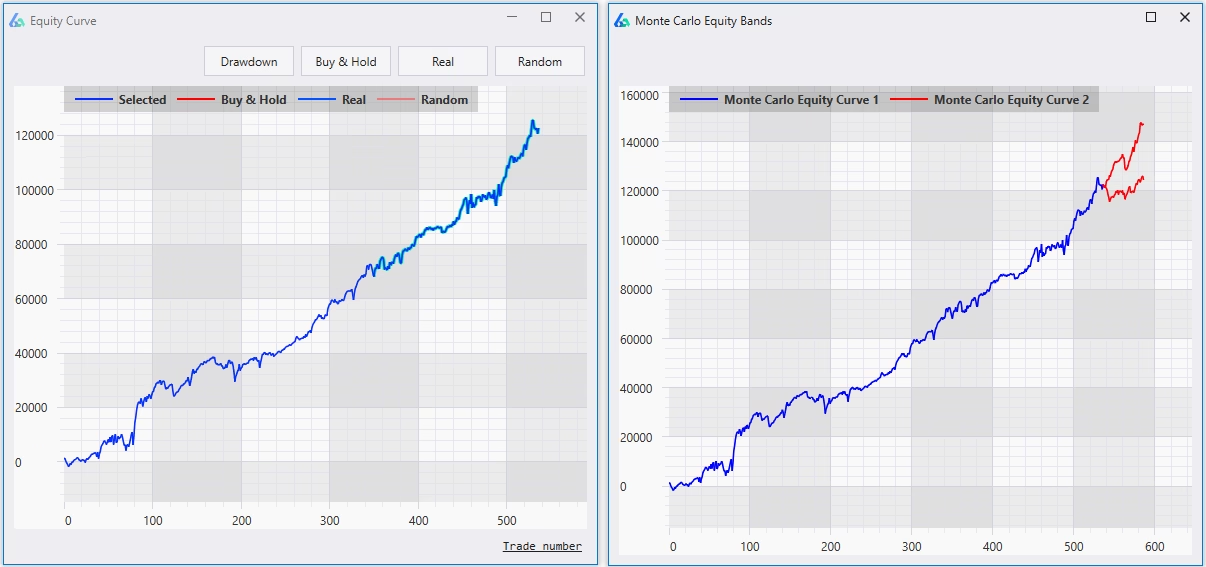
Equity Curve & Monte Carlo Bands
View historical performance by date or trade number. Red Monte Carlo projection bands set proper expectations and serve as a live monitoring threshold.
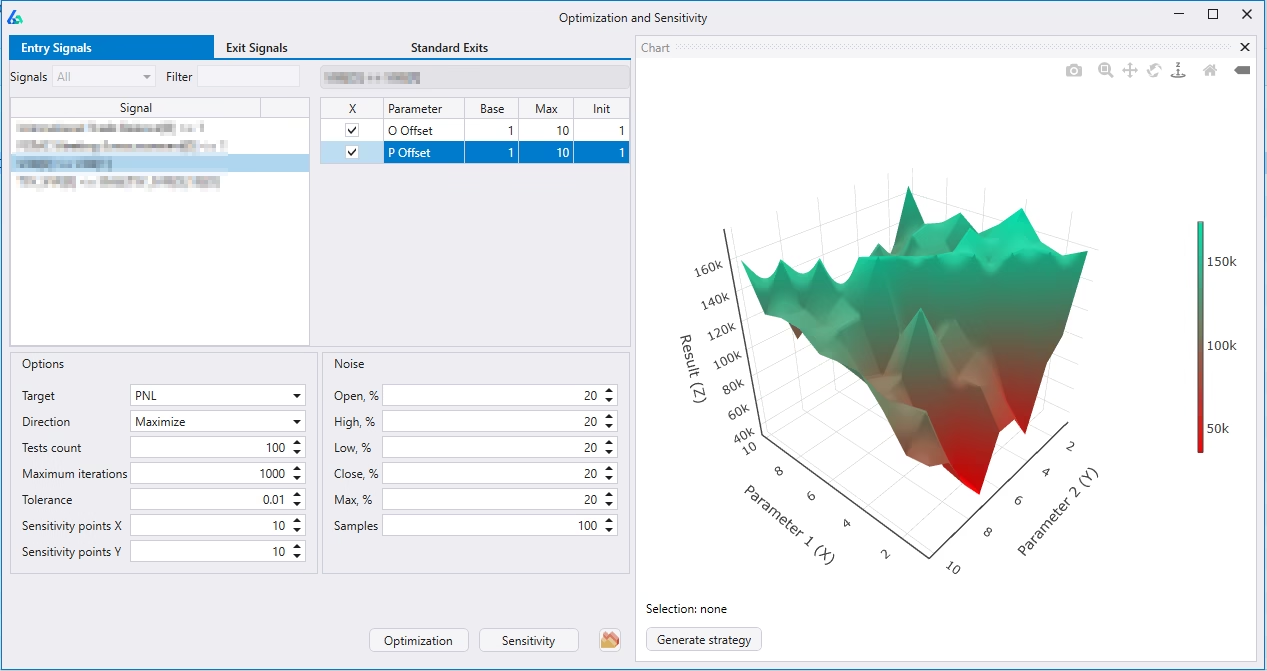
Advanced Optimization
Interactive 3D surface plots for parameter sensitivity. Double-click any point and Build Alpha generates code for that exact setting. Uniquely adds noise-adjusted data into optimization — not available anywhere else.
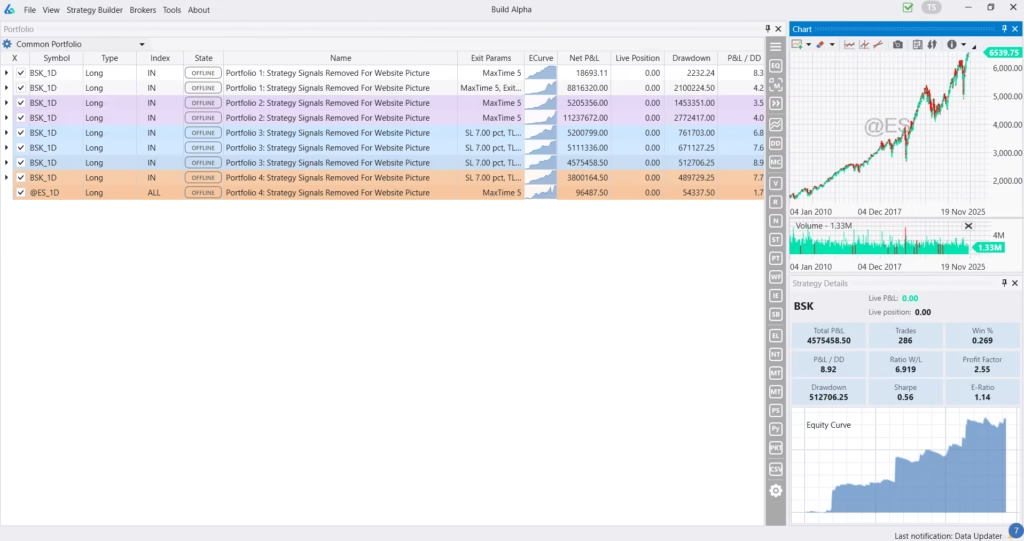
Portfolio
Portfolio Analysis Suite
Don’t just build strategies — learn how they co-exist, interact, and benefit each other.
Multi-Strategy Portfolio
Save, combine, analyze allocation, optimize rebalancing. Organize by color, add notes, test and monitor from one dashboard. Shared accounts, strategy weighting, individual sizing methods.
Correlation Matrix
View strategy correlations using marked-to-market daily returns. Construct uncorrelated portfolios — the holy grail of trading.
Mean-Variance Optimization
Discover optimal weights to maximize Sharpe Ratio across your portfolio. Scroll over the efficient frontier to see individual strategy allocations.
Ensembles & Hedging
Create voting systems — only trade when 3 of 5 strategies agree. Effective to reduce overfitting and smooth portfolio returns.
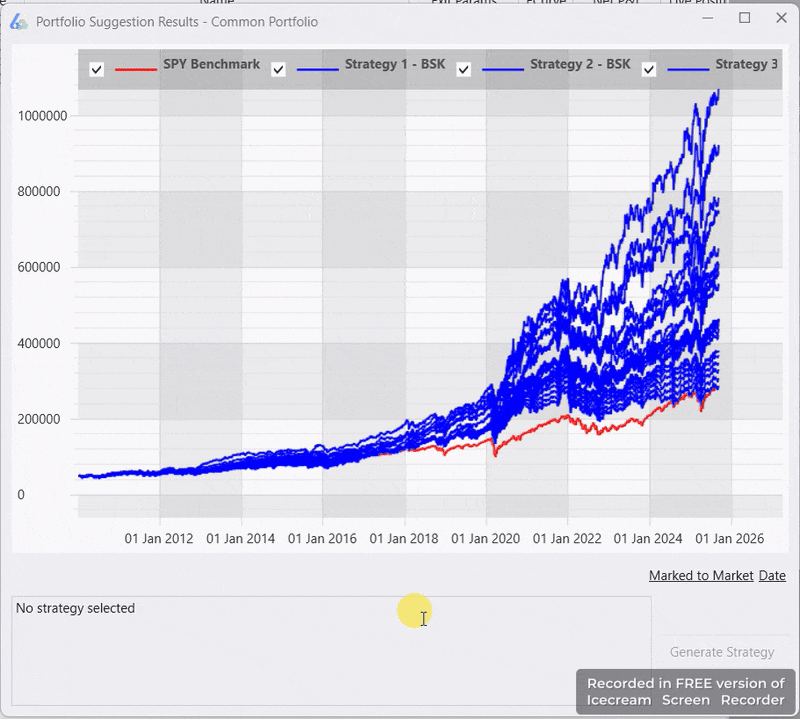
AI-Powered
Portfolio Suggest
One button enables Build Alpha’s AI — trained on thousands of strategies and market environments — to suggest the best sizing, exit modes, strategy combinations, weightings and more.
Rebalance & Regime Switching
Rank your symbol universe and apply strategies to the top-ranked symbols. Or park free cash in another asset when no signal is active — no other software allows regime switching strategies.
Export & Monitor
Code Generation & Live Trading
Generate automatable code for 8+ platforms. Connect to your broker for live monitoring and daily reports.
Auto-Generated Code
Ready-to-trade code for TradeStation, TradingView, MultiCharts, NinjaTrader 8, MetaTrader 4 & 5, Python (IBKR), ProRealTime and more. Copy and paste to go live.

Live Strategy Monitoring
Connect to TradeStation, Interactive Brokers and more. Monitor real-time positions, live P&L, and receive alerts for all saved strategies and portfolios.
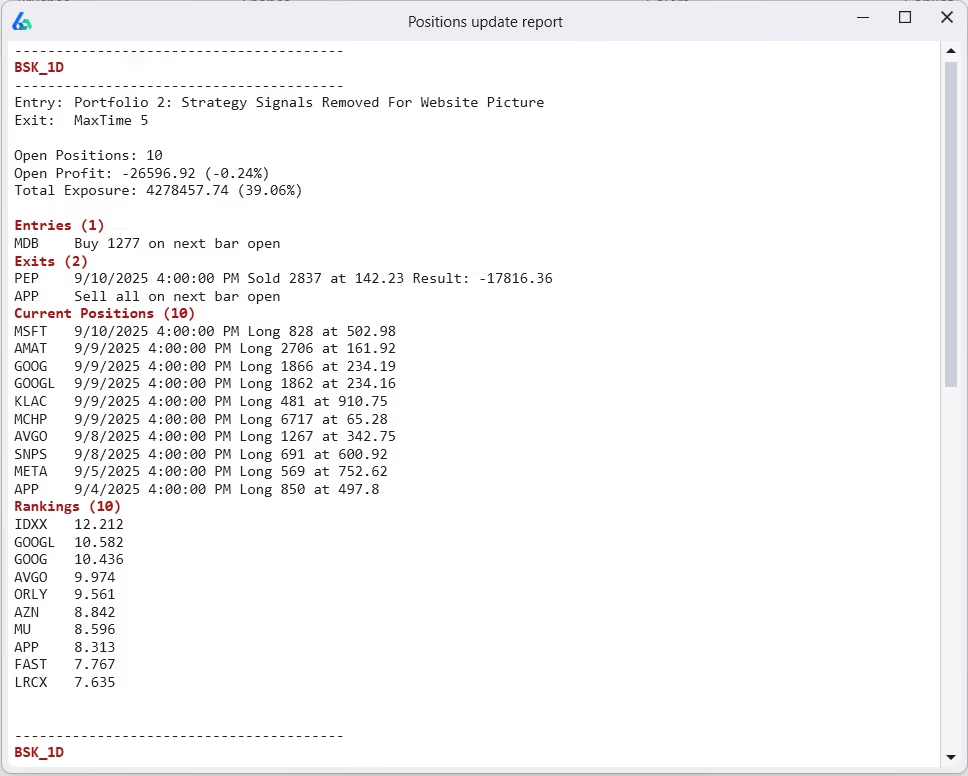
Daily Position Report
Daily update for all saved strategies: what to enter, what to exit, current positions, rankings, open P&L, funds available, total exposure. Track everything without full automation.
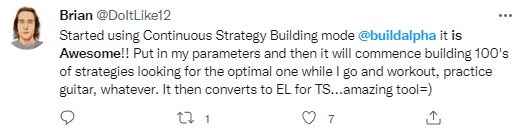
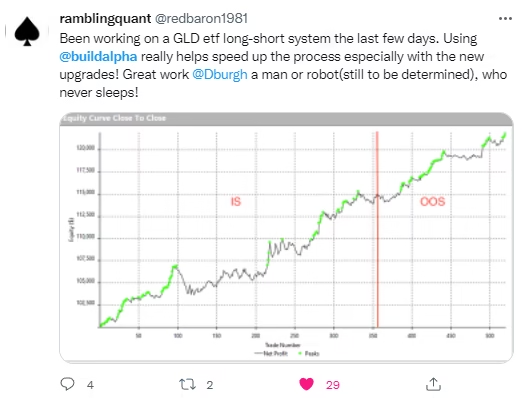
Community
What Traders Say


Ready to BUILD ALPHA?
Minutes, not months. No coding required. Used in 70+ countries.