How To Use
Point. Click. Trade.
Build automated trading strategies using Build Alpha’s point-and-click interface. No programming necessary.
7,000+ Signals
Entry, exit & filter signals
12+ Stress Tests
Proprietary robustness suite
Auto Code Gen
8+ platforms at the click of a button
Features
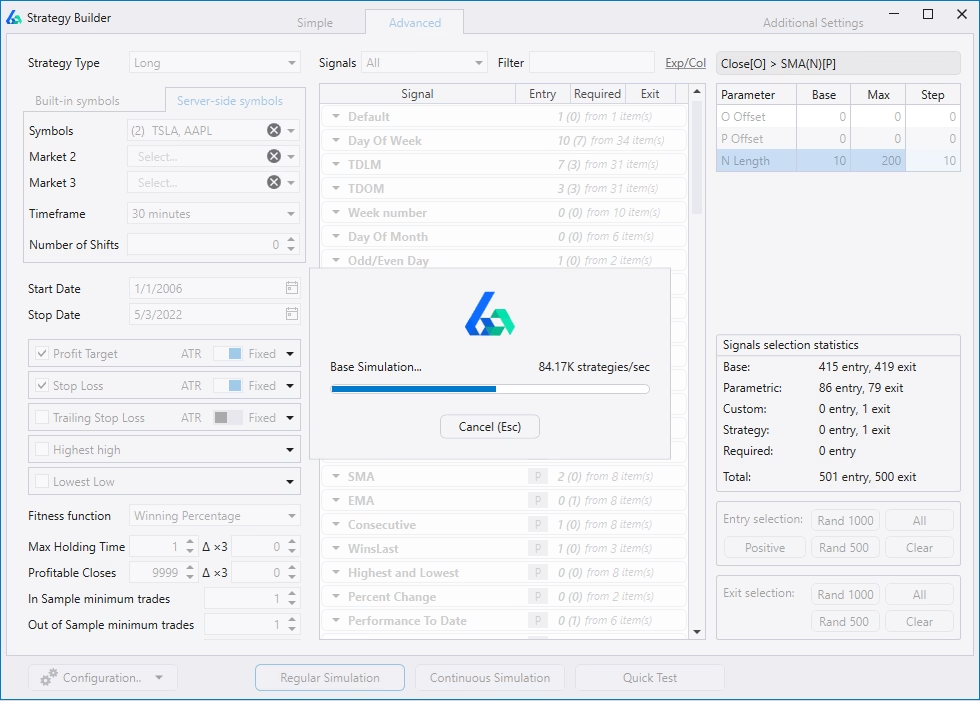
Input Interface
This is the screen that allows you to set up every aspect of your strategy simulation exactly how you wish.
- Long or Short
- Market of Choice
- Test Dates & OOS %
- Entry Signals (7,000+)
- Exit Criteria
- Fitness Function
- Min Trades (IS & OOS)
Coverage
Markets Available
30+ futures, 30+ ETFs, 30+ forex pairs, US stocks. Data going back 10+ years, some to the 1960s.
eMini S&P500eMini NasdaqeMini Dow JoneseMini Russell 2000eMini NikkeieMini S&P500 MidcapGerman DAXVIX Futures
US 2 YearUS 5 YearUS 10 YearUS 30 YearGerman 10 Year Bund
CornWheatSoybeansSoybean OilLive CattleFeeder CattleLean HogsCoffeeOrange JuiceSugarCocoaCottonOatsRough Rice
OilNatural GasGoldSilverCopperPlatinumGasolineHeating Oil
YenEuroPoundAussieCanadianDollar IndexSwiss FrancBitcoin
SPYQQQDIAIWMTLTUSOGLDGDXHYGJNKIBBSMHEEMEWZEWHEWIEWAEWGRSXEWCEWQEWUXLYXMEXLUXLIXLKXLEXLFXHBXLPXLBXLV
AUD/CADAUD/CHFAUD/JPYAUD/NZDAUD/USDCAD/CHFCAD/JPYCHF/JPYEUR/AUDEUR/CADEUR/CHFEUR/GBPEUR/JPYEUR/NZDEUR/SEKEUR/USDGBP/AUDGBP/CADGBP/CHFGBP/JPYGBP/NZDGBP/USDUSD/CADUSD/CHFUSD/JPYUSD/MXNUSD/SEKBTC/USD
Cryptocurrency, US Listed & Delisted Stocks and ETFs also available. You can import your own data as well.
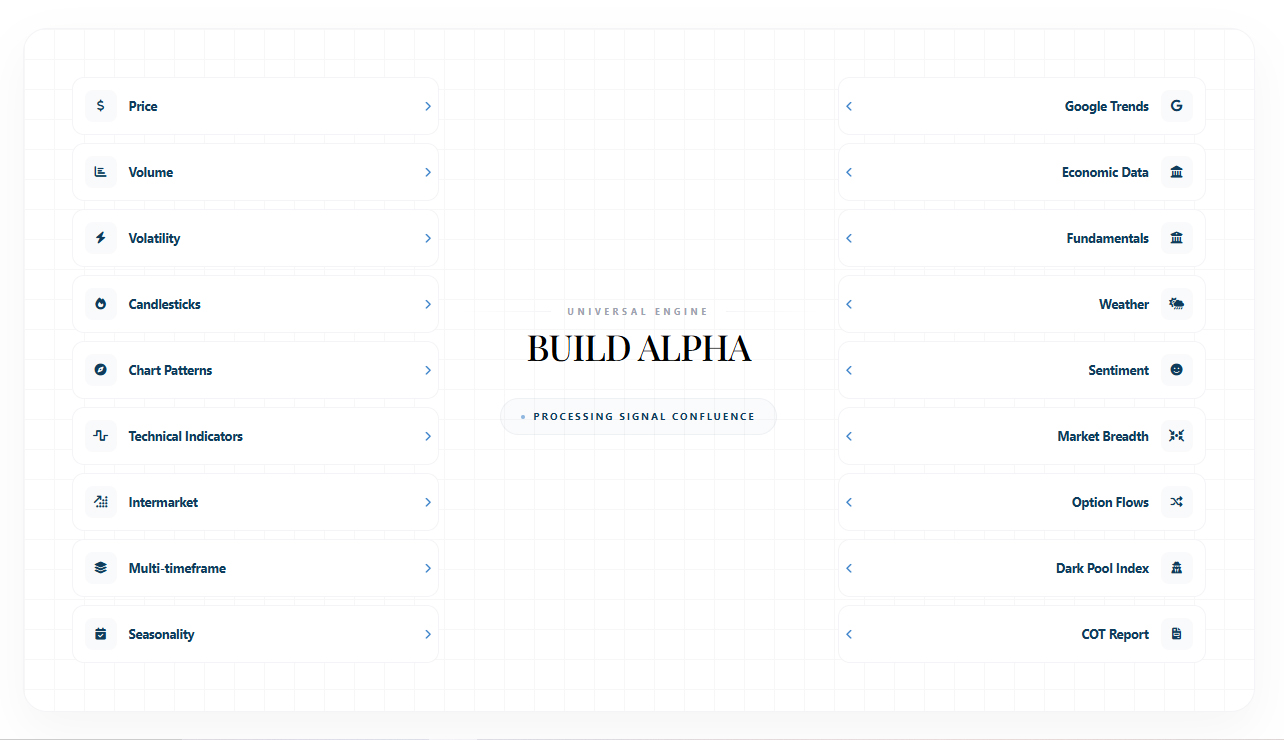
7,000+ Signals
Entry Signals
Build Alpha offers over 7,000 pre-built entry signals. MACD, RSI, Stochastics, ATR, Kaufman Efficiency, Hurst Exponent, DMI, Moving Averages, Composite Indicators, candlesticks, volume analysis, seasonality, holidays and much more.
100,000+ Combinations
Exit Criteria
All 7,000+ entry signals double as exit signals. The input interface lets you combine them into over 100,000+ unique exit configurations.
Optimization
Fitness Functions
Metrics used to compare and evaluate trading systems. Select one and Build Alpha will search for strategies that optimize that metric.
Winning %
Net Profit
Drawdown
Profit / Drawdown
Win / Loss Ratio
Profit Factor
Average Trade
Sharpe Ratio
Sortino Ratio
SQN
K-Ratio
CPC Ratio
CAGR
Correlation Coefficient
T-Statistic
System Quality Measure
Perfect Profit %
Custom
Net Profit
Drawdown
Profit / Drawdown
Win / Loss Ratio
Profit Factor
Average Trade
Sharpe Ratio
Sortino Ratio
SQN
K-Ratio
CPC Ratio
CAGR
Correlation Coefficient
T-Statistic
System Quality Measure
Perfect Profit %
Custom
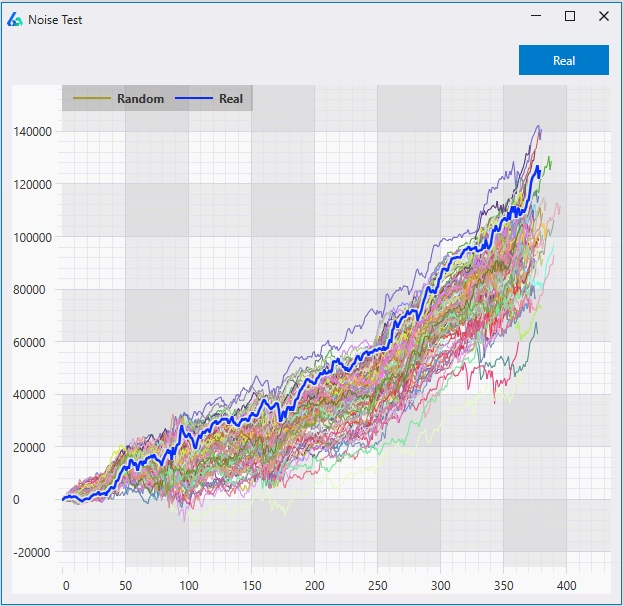
Anti-Curve Fitting
Robust Strategies
Yes, it is very easy to data mine and wind up with a curve-fit system. Build Alpha has functionality to prevent it before ever beginning.
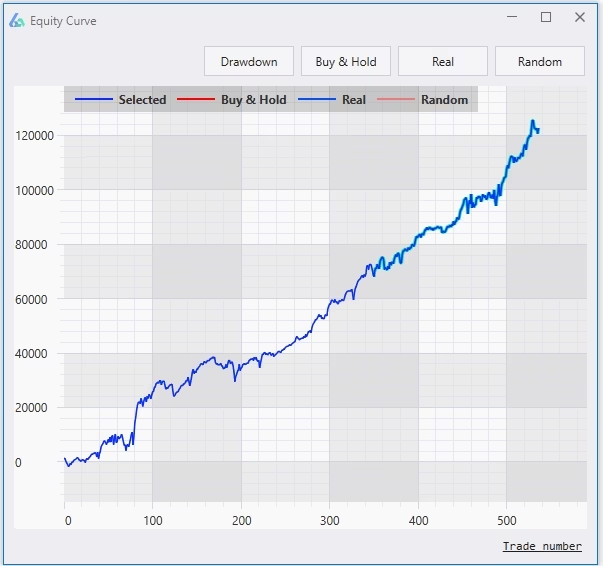
Results
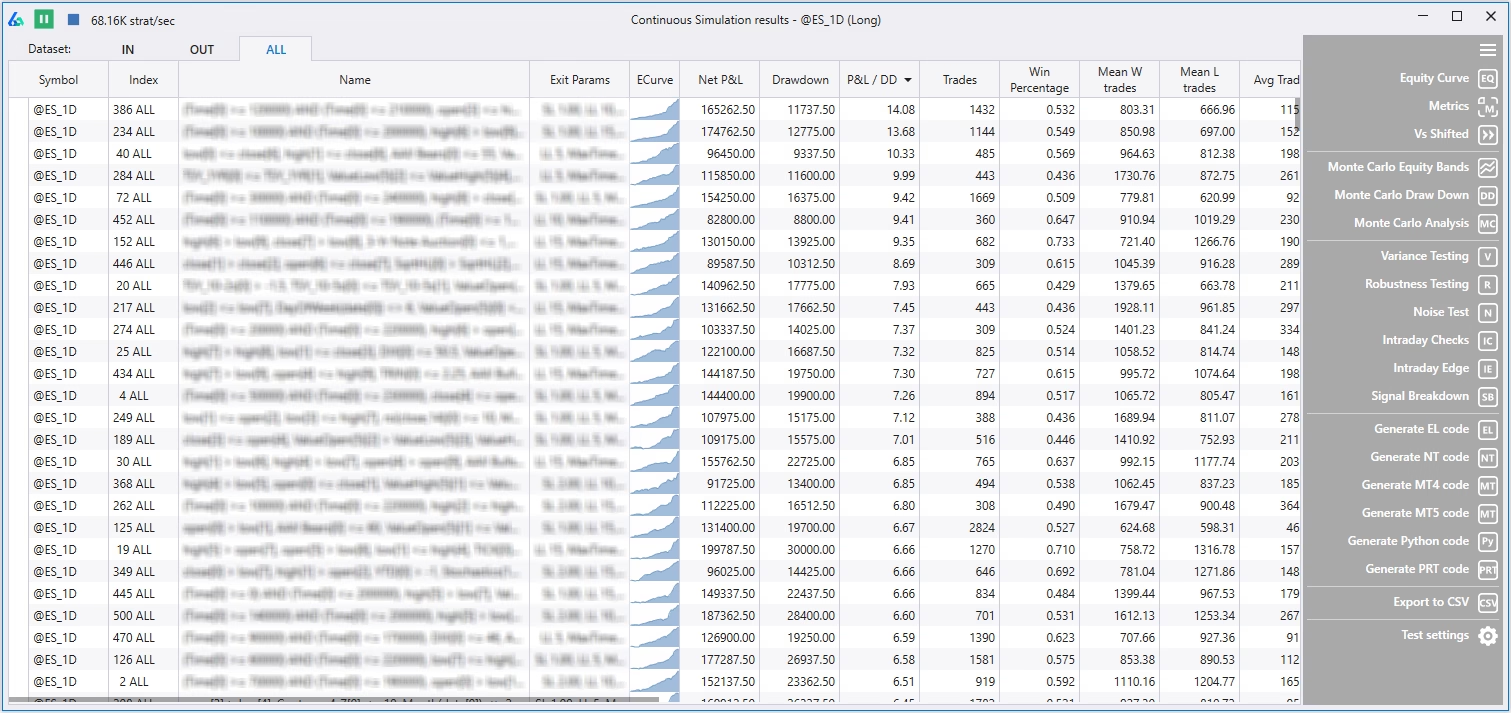
The Output Interface
After searching hundreds of thousands of strategy combinations, the Output Interface displays every strategy found — sortable by profit factor, win %, net P&L, drawdown, Sharpe, number of trades and more.
Portfolio
Portfolio Analysis Suite
Add any strategy into a custom portfolio. Run every visualization and robustness test at the portfolio level.
Portfolio Builder
Add any strategy to a portfolio. View combined equity curves, Monte Carlo drawdown analysis, and variance testing. Create multiple portfolios, receive daily updates to position and exposure changes.
Correlation Matrix
View how correlated each strategy is with each other using marked-to-market daily returns. Construct portfolios of uncorrelated strategies to optimize future success.
Minimum Variance Portfolio
Modern Portfolio Theory applied to strategy allocation. View optimal weights for each strategy to maximize risk-adjusted returns (Sharpe Ratio) — an advantage over traditional position sizing.
Community
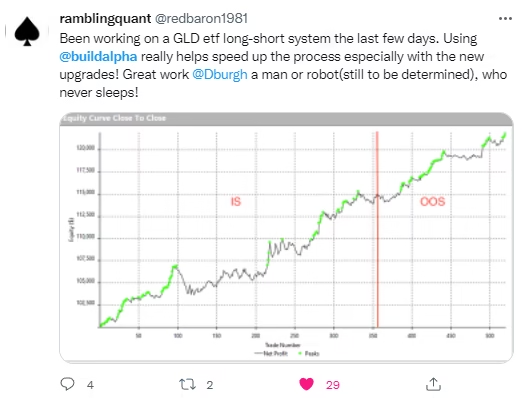
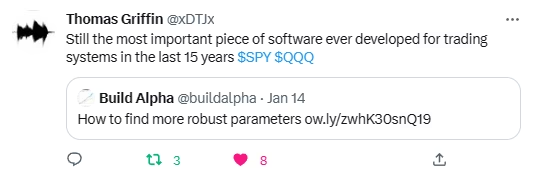
What Traders Say


Ready to BUILD ALPHA?
Minutes, not months. No coding required. Used in 70+ countries.