Portfolio trading is combining many independent, uncorrelated trading strategies into one shared account to gain some net benefit from their combination. One should design automated trading systems to handle and capture different market effects and environments to maximize this benefit.
Next, one needs to figure out how to combine these trading strategies to best improve the overall risk-adjusted return (or whatever your portfolio’s objective may be). This is [successful] system trading 101.
A Portfolio backtest splits the starting capital among the various individual trading strategies to see how the interplay of strategies affects the shared capital pool (aka our account).
In this post, I will discuss how we rebalance capital, why we rebalance capital, when to rebalance capital, and why we need many uncorrelated trading strategies vs. a single “holy grail” strategy.
Why Portfolio Trading?
There is no “holy grail” strategy. Sorry. I have been using machine learning and artificial intelligence for a decade-plus and have yet to find it. What’s worse is that over-optimizing, constant tweaking, and adding complex rules produce great-looking backtests which fail in live markets. Trust me.
The real “holy grail” is combining multiple strategies into one capital-aware portfolio.
The goal isn’t one perfect strategy — it’s a team of [robust] strategies that work well together. Some perform in bull markets, others in bear markets; some thrive in calm conditions, others in crises. Since no one knows what tomorrow brings, your portfolio should be prepared for all environments.
To do this, strategies must be different from each other. If they’re too similar, you’re just taking the same risk twice while adding operational complexity (yuck). We measure difference with correlation: ideally, when one strategy zigs, another zags — like pistons in a car engine (some up, some down but car moves forward).
Mixing strategies across assets, timeframes, frequencies, and styles (effect capture) builds a far more robust portfolio.
Combining Strategies to Improve a Portfolio
Below are three simple strategies that no one would trade by themselves. However, the historical drawdowns of these three strategies do not happen at the same time so when the strategies are combined, we notice improved performance (green equity curve).
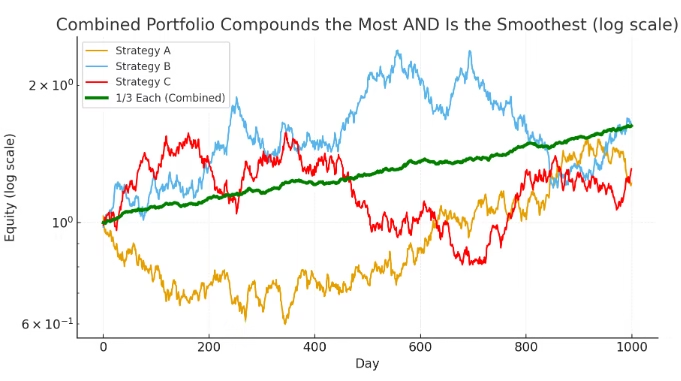
And notice the drawdowns! On its own, each strategy experienced a 40%+ reduction from its peak equity at one point, but the combined hypothetical example never experienced even a 5% haircut.
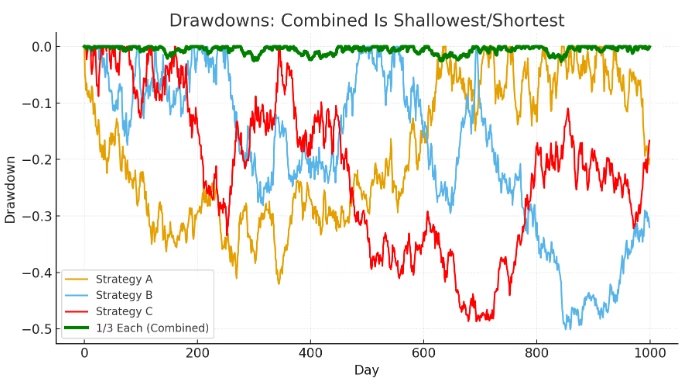
This, generally speaking, is what we aim to achieve with portfolio trading. The coveted “holy grail”.
Parrondo’s Paradox in Trading
Wikipedia defines the Parrondo’s Paradox in Game Theory as “a combination of losing strategies that becomes a winning strategy”. Below is a brief video explaining Parrondo’s Paradox and loosely explains what system traders aim to achieve by combining uncorrelated strategies together.
This video begs the question: can we combine two bad strategies into a winning strategy?
The answer is (mostly) yes, but it is not done through simply combining two bad strategies together. We cannot just mash any two strategies together and voila.
An example portfolio
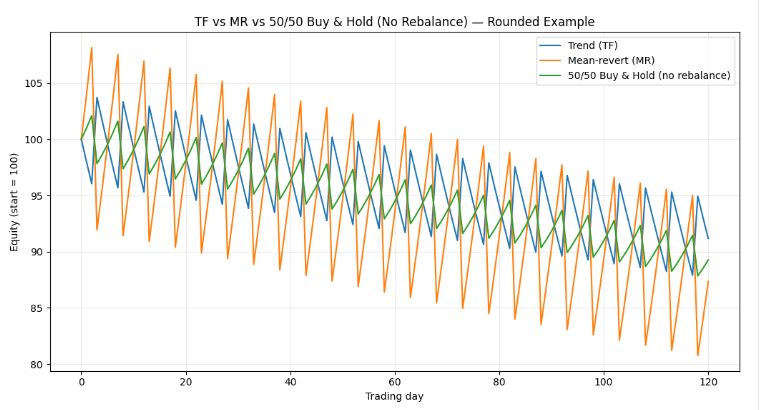
Trading is never that simple. Take this simple proxy portfolio
- Trend Following (TF) proxy: 20% win rate, 8% average win, -2% average loss
- Mean Reversion (MR) proxy: 80% win rate, 4% average win, -15% average loss (occasional crash)
Both of these systems are losers on their own (negative geometric return). And if we give each 50% of our capital and mash together as a portfolio we still lose (green line).
But wait…
Portfolio Rebalancing is key
Rebalancing our capital every day turns the combined equity curve into a winner (red line). The “daily” 50/50 rebalancing mechanically sells what just went up and buys what just went down.
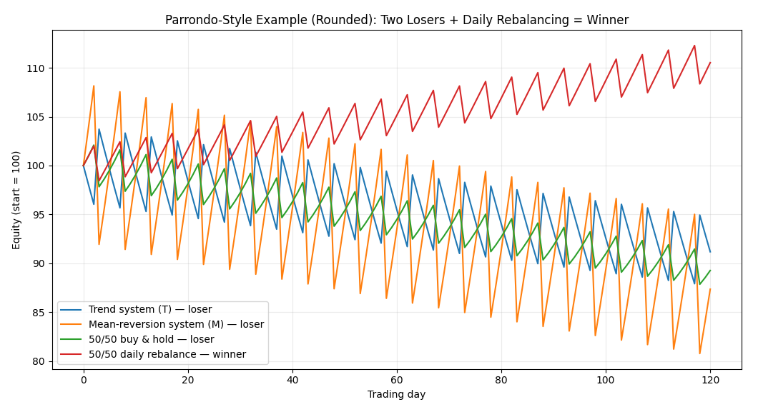
When strategies are sufficiently uncorrelated or negatively correlated, and volatile enough, this creates a rebalancing premium (sometimes called Shannon’s Demon).
The effect or positive return comes from harvesting the volatility when we rebalance the capital. In quant speak, the geometric return is roughly the arithmetic return – 1/2 of the variance.
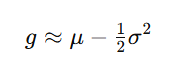
As we combine strategies (and rebalance the capital) the portfolio variance drops a lot more than the arithmetic mean does. This can flip the geometric mean positive!
In English please…
That is, we must pool the capital together and reallocate periodically in order to experience Parrondo’s Paradox in our trading accounts.
Not so fast
So just rebalance every day? No, there’s trading costs. And why 50/50 rebalancing? And what about correlation? And what if mid-trade our 50/50 weighting becomes 70/30? And what if, and what if, and what if, and.. hold on.
Rebalancing isn’t magic. It only helps when the strategies take turns leading (low/negative correlation) and have enough volatility/dispersion to harvest — and even then, trading costs can erase it.
Rebalancing can also hurt when one strategy is the clear long-run winner: you’re constantly selling the winner to buy the laggard, which reduces terminal wealth. We rarely know if we’ll have one long-run winner or which it will be, though.
In other words, if the strategies don’t “take turns” (correlated or very different long-run growth rates), frequent rebalancing can act like a “sell your best idea” tax.
In short, it is vital to combine uncorrelated, unrelated strategies to capture this effect! Not similar strategies.
So where does that leave us now?
New Questions
We know we want to combine unrelated strategies but now have new variables and a bunch of new questions. For instance, we now ask:
- what strategies to combine
- what weights to give them
- what correlation is acceptable
- how to size strategies
- show we rebalance capital
- how often to rebalance
- what about in-trade adjustments (e.g., 50/50 becomes 70/30)
Yep, an explosion of new things to test. “Hey, I’m barely working my way through my strategy ideas and now I have to answer portfolio questions? Come on, man. Can BA help?”
Build Alpha Portfolio Mode
Build Alpha’s portfolio mode enables traders to save strategies, combine them, analyze asset allocation methods, optimize rebalancing frequencies, and more. Let’s go through some of the core features below.
Fundamental Data and Factor Analysis
Build Alpha signed a data deal with the Nasdaq to offer fundamental data for building trading and investment strategies. This allows equity traders to filter symbol universes to only trade when Free Cash Flow or Revenues or Price to Book or PEG ratio or any other fundamental data point is to your liking.
This also enables Build Alpha to build and test various factor models such as market, size, value, profitability, investment, momentum, etc. The price data provided by Nasdaq is split and dividend adjusted.
Combining investment strategies built on different factors is one of the most time-tested methods for portfolio construction.
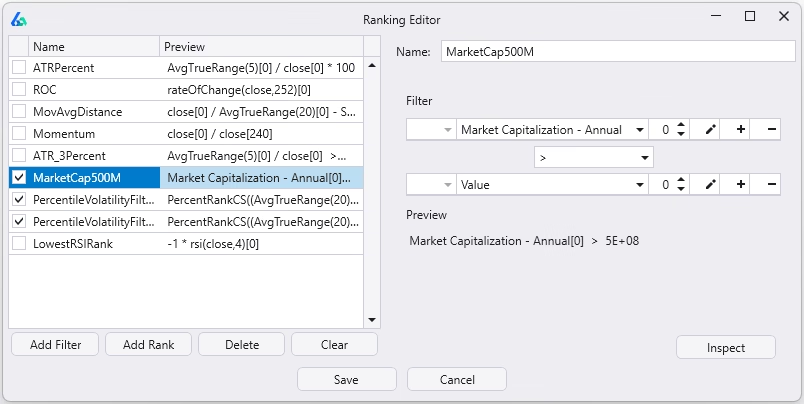
Custom Filters and Ranks
Filters are rules of what is trade-able and what is not. For example, only trade stocks or ETFs with an average daily volume greater than $10,000,000 or only trade futures with an average true range (ATR) at or above the 70th percentile or growth mutual funds above $5 or whatever.
Ranks are how you determine what symbol gets an allocation when you have more entries than available slots.
We can rank on anything: relative strength, volatility, market cap, momentum or any custom ranking you can imagine. Use the no-code editor to build rankings and review current rankings using the Rank Inspection tool (pictured below).
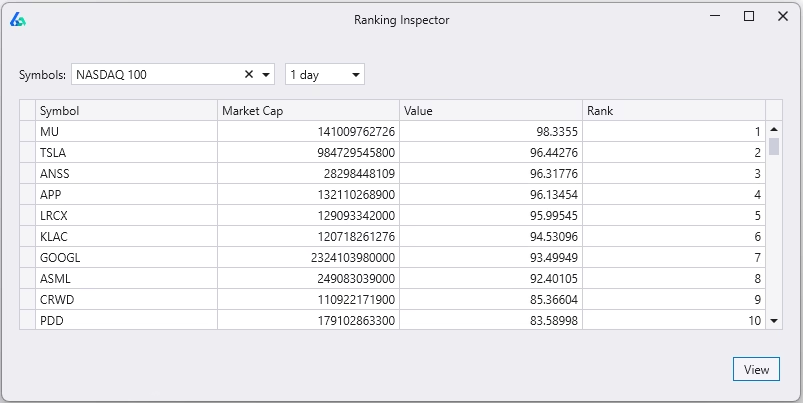
Create a library of filters and ranks, and let Build Alpha show which ones work best for your strategy.
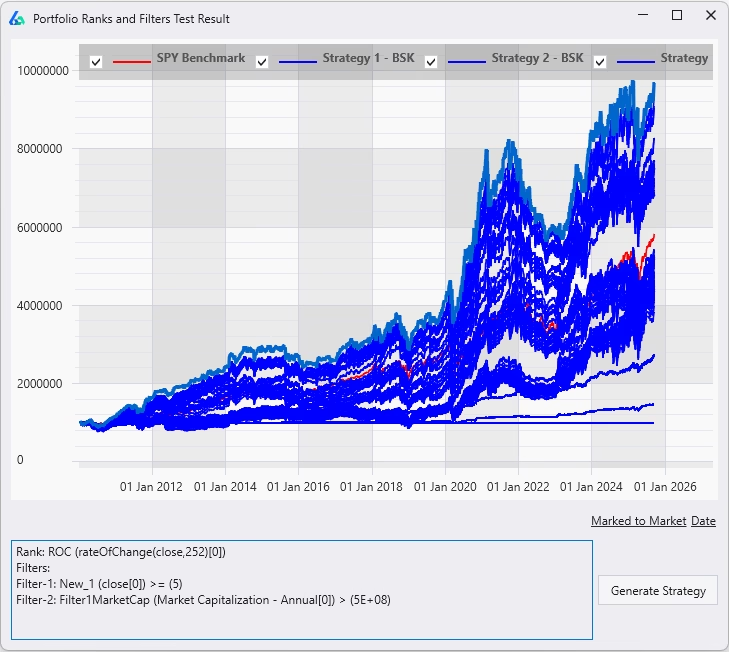
The results above show different combinations of filters and ranking methods applied to the core strategy. The selected row shows how the strategy performs when stocks under $5 or below $500M in market cap are excluded, and the remaining stocks are ranked by 252-day rate of change.
Portfolio Analysis and Visuals
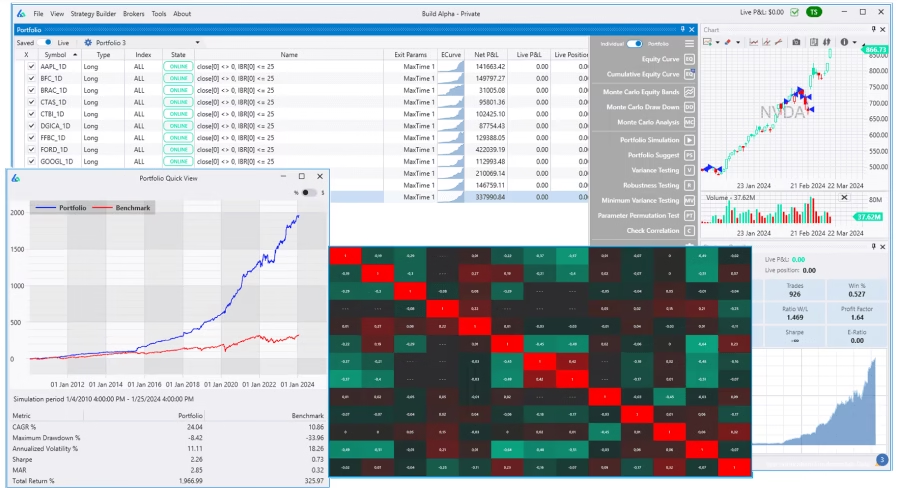
Build Alpha portfolio mode comes with all standard visuals and metrics such as equity curve comparison to buy and hold, performance metrics, correlation matrix, minimum variance test, and the institutional-grade robustness tests you all know from Build Alpha. Below shows an equity curve and correlation matrix.
A Quick Note About Other Portfolio Backtesters
Most portfolio tools just merge trade lists (txt or csv files) from multiple strategies. This cannot model real portfolio behavior because it does not know how trades would change when strategies share capital.
Example: a strategy that sizes positions based on stop-loss distance might only take 3 trades in its own backtest because capital was fully used. In a real portfolio, profits from other strategies could free up enough capital to take a 4th trade—but a trade-list simulator will never add this 4th trade, so the results are unrealistic.
Build Alpha solves this by re-simulating the strategies together, tracking capital in real time and letting strategies interact the way they would in live trading—something static trade lists can’t do.
Build Alpha – An Adanced Portfolio Backtesting Tool
Build Alpha is built for both independent traders and professional managers (CTAs and RIAs) running multiple strategies across multiple client accounts. It’s flexible enough to support a wide range of workflows and requirements—while also avoiding the common portfolio-simulator pitfalls mentioned above.
Backtesting Portfolio Strategies with Various Exit Strategies
Many equity investors and Registered Investment Advisors utilize strategies that rank a symbol universe periodically and only trade the top N signals. However, what happens when a position grows to be too large a percentage of your portfolio? Should we immediately reduce size? Or what happens if the stock falls out of the top N ranked stocks? Should we immediately close the position and add a position in the newly ranked stock?
New questions mean new tools.
Build Alpha has various exit modes for portfolio strategies to give traders flexibility:
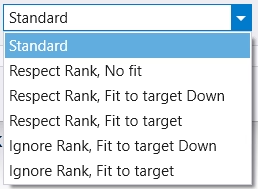
(Terms: Standard exit = stop-loss, trailing stop, or signal exit. Rank = position’s standing vs your universe. Fit to target = enforce position-size target E (e.g., 10%). “Down only” trims but never tops up.)
- Standard — Close the position only on a standard exit. Ignore rank and size while held. Lets winners run (no trimming if it appreciates or drops in rank).
- Respect Rank, No Fit — Close on any standard exit or when the stock falls out of the top N (your max positions). Example: Max positions = 10; if a holding becomes rank 12, it’s closed.
- Respect Rank, Fit to Target Down — Same as above plus enforce max exposure E: trim if the position grows above E; do not add if it falls below E.
- Respect Rank, Fit to Target — Same as above, but rebalance both ways: trim if >E and top up if <E.
- Ignore Rank, Fit to Target Down — Close only on standard exit; ignore rank changes. Trim positions that exceed E; never add when below E.
- Ignore Rank, Fit to Target — Close only on standard exit; ignore rank. Rebalance to E whether the position is above or below target.
These provide the trader or investor the ability to create constant volatility targeted portfolios or ones that hold for the long-term aiming to capture large trends. This flexibility is paramount with many use cases.
In-Trade Adjustments and Rebalance Periods
We have all been in a trade when volatility drastically changes. That is, we may size based on current volatility but a few bars later the volatility has collapsed, and we do not have enough exposure or a few bars later volatility explodes, and we have too much exposure!
Build Alpha allows traders to enable In-trade adjustments where Build Alpha will re-size positions if they deviate from the desired or current size by a certain percentage threshold. Below would re-size a position whenever the current exposure deviates 10% or more from your desired position size.
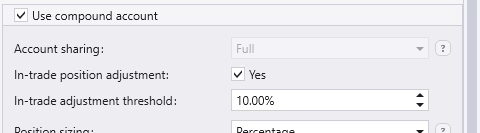
This constant or continuous adjustment helps smooth returns and helps traders and investors target certain volatility levels.
This is akin to a Hold ’em Poker player changing his bet as new cards (data) are unveiled. A poker player doesn’t determine his bet size at the beginning of the hand and wait until the end of the hand (trade’s exit). He adjusts his exposure mid-hand, multiple times often. However, in trading, we can adjust our exposure both up and down – how cool!
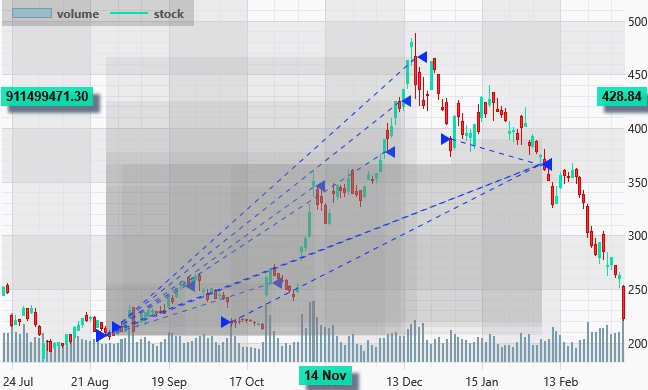
Here is an example TSLA trade with many in-trade adjustments (buys and sells to resize the position as needed).
Walk Forward Test to Backtest Portfolio Strategies
Walk Forward Testing splits the historical data into multiple training and testing partitions where we optimize strategy parameters during the training data (in-sample data, blue below) and test the best parameter settings on the unseen (out-of-sample, green below) data.
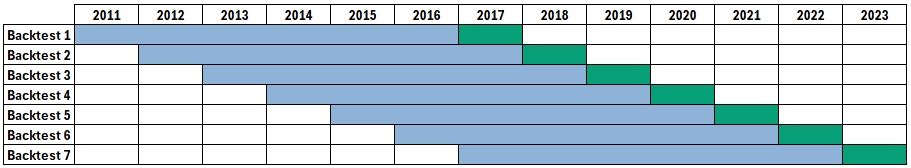
This process is repeated until we “walk forward” through the entire historical data set which ultimately allows the trader to combine all out-of-sample data (green boxes) into one truly out-of-sample equity curve.
Build Alpha enables you to do this with a single strategy or a portfolio of strategies and you get this results window which shows performance and risk metrics for every out-of-sample period for the portfolio. Expand any row and view the individual strategies’ performance during any OOS period.
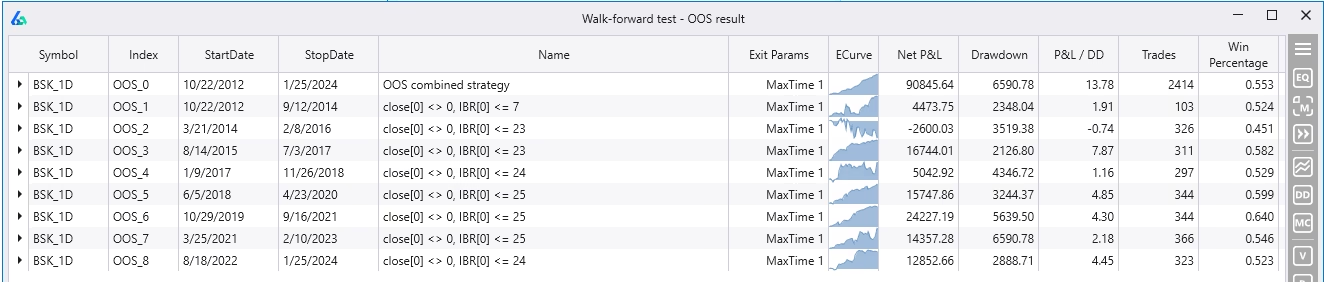
One can gain insights into how often one should re-optimize a strategy or how much ideal parameters have/do change over time. I wrote more about Walk Forward Optimization here.
Portfolio Suggest – AI Asset Allocation
Build Alpha’s Portfolio Suggest feature is a single button that enables Build Alpha’s AI, that was trained on thousands of strategies and market environments, to sift through your saved strategies and suggest the best sizing method, exit modes, combination of strategies, weightings, and more so you do not have to test every combination yourself.
Below are results of the Portfolio Suggest feature. The blue lines are various combinations, weightings, sizing methods that Build Alpha simulated based on the saved strategies in the portfolio. The red line is Buy and Hold (S&P 500).
See what settings were applied to create each equity curve. The Generate button opens a new results window for the selected settings for further analysis.
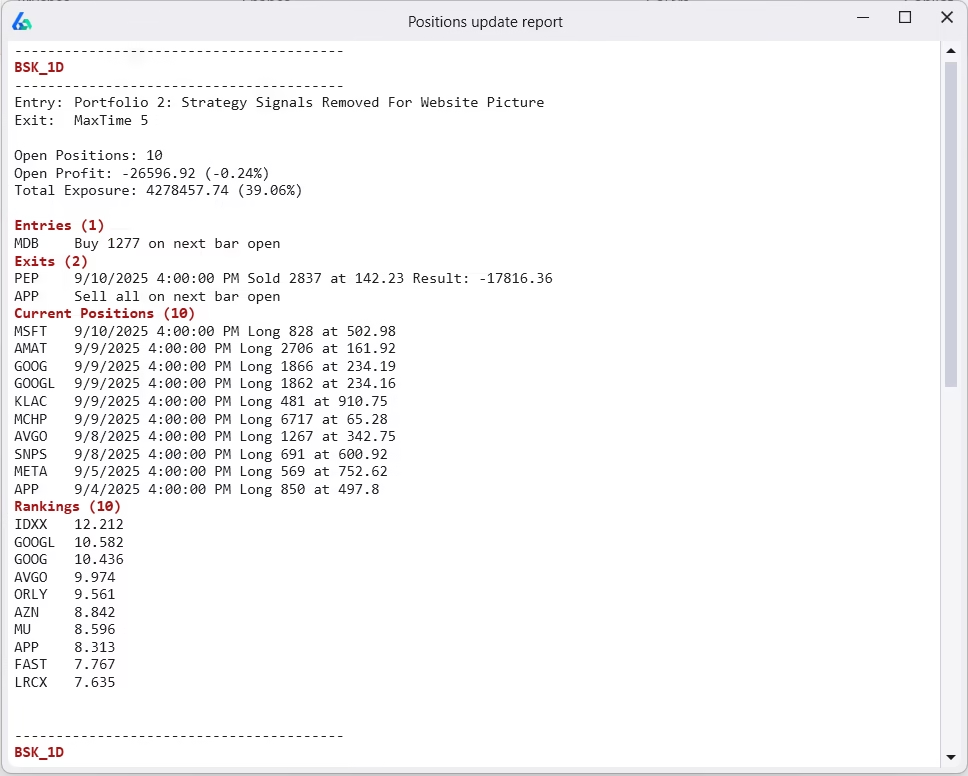
Position Update Report
Build Alpha runs a daily report to update all your saved strategies. This overview gives an update on every saved strategy. The report includes:
- What to enter
- What to exit
- Current Positions
- Current Rankings
- Open P&L
- Funds Available
- Total Exposure
This is the simplest way to track portfolio strategies and get daily updates. This is also for all of the new Build Alpha members that are not ready for full automation! The data updates overnight so this feature is best run before the US market opens.
Multiple Portfolios in one place
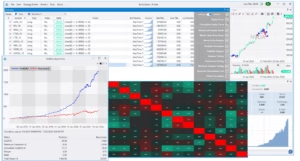
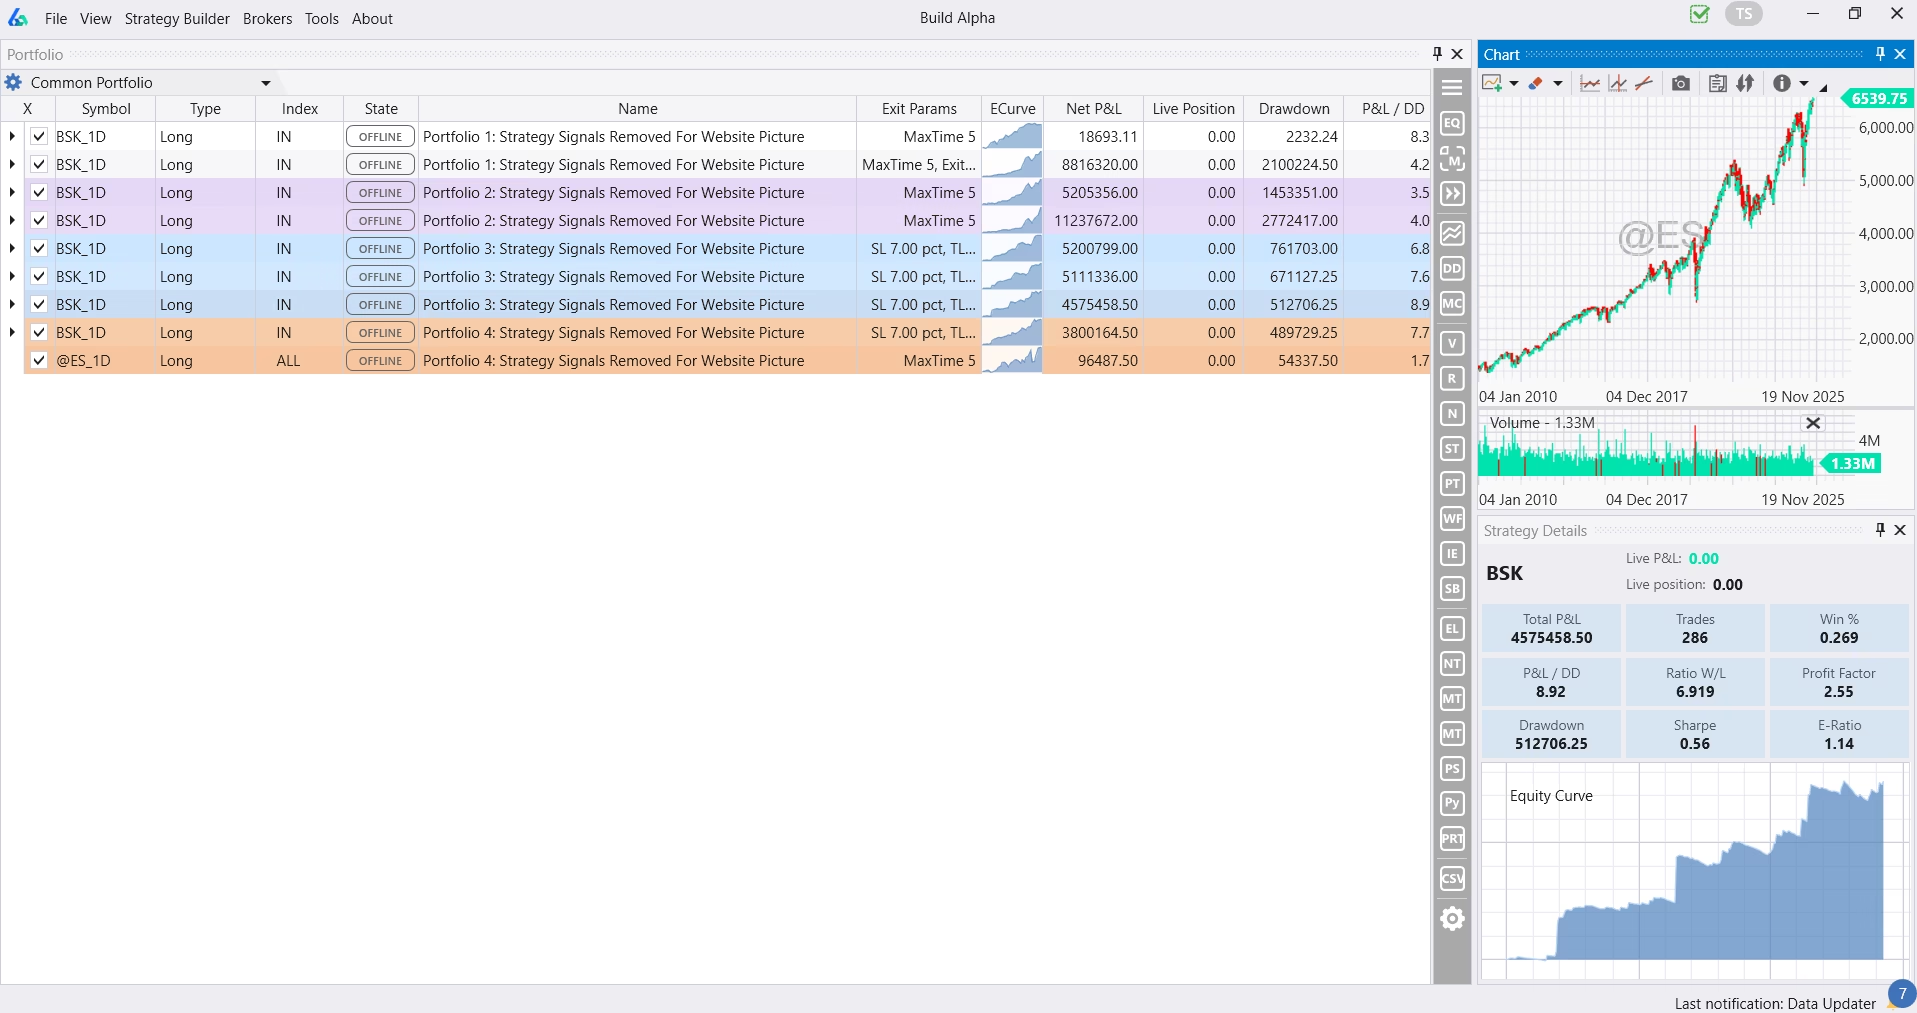
Color code, name, and organize all your saved strategies into different portfolios. This gives a one screen summary to view risk metrics, compare strategies, and keep tabs on all your hard work. There is a dropdown in the upper left that will allow you to move between each portfolio or view the combined Common Portfolio (pictured below).
Build Alpha Portfolio Mode
What’s Included
- Multi-strategy portfolio simulation
- Portfolio Suggest AI
- Multi-strategy walk-forward testing
- Portfolio filters and ranks
- In-trade volatility adjustments
- Fundamental data access (Nasdaq)
- Ranking inspector
- Save multiple portfolios
- Daily position update report
Please email me with any questions and check out the Build Alpha V3 Update to see what else is new in the latest release.