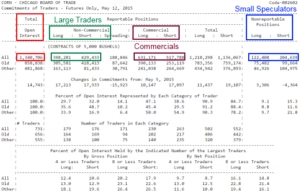
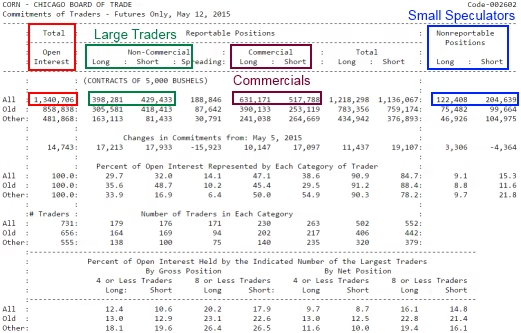
The Commitment of Traders Report is a weekly report released by the Commodity Futures Trading Commission (CFTC) that shows the open interest for futures and options on futures in markets with 20 or more traders holding positions above or equal to the reporting levels established by the CFTC. The report shows open interest data as of Tuesday but is not released until Friday afternoon.
The reports are based on open interest position data supplied by reporting firms such as FCMs, clearing members, foreign brokers and exchanges. The data is categorized by the trader’s dominant business purpose self-reported by traders on the CFTC Form 40 and is subject to review by the CFTC.
The report is broken down into three different types of traders:
Commercial traders (hedgers): Traders in this category are typically considered to be market professionals, such as producers, processors, users, merchants, and swap dealers. These traders use futures markets to hedge against price changes in the underlying commodities. They are considered to have a direct commercial interest in the underlying commodities.
Non-commercial traders (large speculators): This category of traders is considered to consist of speculators who trade futures contracts for financial purposes, rather than to hedge against price changes in the underlying commodities. These traders include hedge funds, Commodity Trading Advisors (CTAs), individual traders, and other investment firms.
Nonreportable (small traders): These traders are defined as those holding positions below the reporting levels established by the CFTC. Traders in this category are considered to have less impact on the market and provide valuable insight into market sentiment and behavior. Their positions are classified as non-reportable positions in the COT report.
Smart Money vs Dumb Money
The COT report is broken down into three categories of traders and often the commercial traders and to a lesser extent the non-commercial traders (large speculators) are considered “smart money”. The nonreportable category is often called small speculators or retail traders which unfortunately gets the moniker “dumb money”.
Watching the divergence between smart and dumb money can often leave clues to direction or market sentiment which can help influence trading approaches. The most popular COT trading style is watching when these two categories diverge to extremes as large divergences between smart and dumb money is typically when or how the market moves. Someone has to be someone’s liquidity!
Is there Free COT Data?
Yes, COT data is freely available on the CFTC’s website at cftc.gov and then navigating to the Commitment of Traders report link here: Commitments of Traders | CFTC
However, the historical data from COT reports are not formatted for easy use and often needs modification to make useful futures markets signals. More on how Build Alpha does this later.
How can traders use COT data?
Simply using the commitments of traders reported data as a trade signal is not a great idea! The data is shared as long and short positions and is not normalized for Tuesday’s open interest. Instead, the values are just raw values and rather meaningless on their own. For instance, is a number of 10,374 contracts long a lot or a little? Well, it depends on what open interest is! And how many contracts are short!
There are two simple ways of deriving signals from COT data. First, the normalized net position which is expressed as a percent. Positive 20% would mean the net position is long and 20% of open interest. The second way is the COT Index.
What is the COT Index?
The COT Index or Commitment of Traders (COT) Index is a popular trading indicator showing where current net positioning is in relation to historical positioning of the same trader group over the past three years (36 months).
A COT Index reading of 100 means the group is the most bullish compared to any point in the past 36 months and a reading of 0 means the group is the most bearish compared to any point in the past 36 months. The COT Index can be calculated on Commercials, Non-Commercials, or Non-Reporting traders.
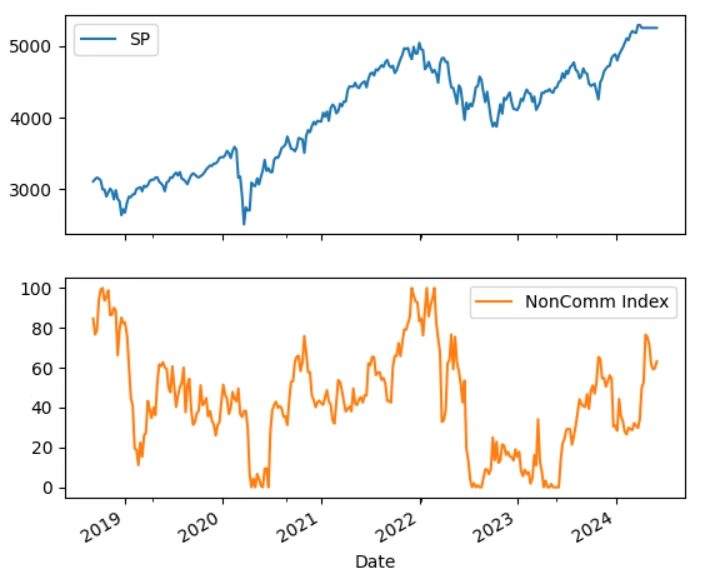
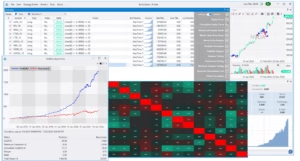
Above is an image showing the SP500 price fluctuations with the non-commercial trader (large speculators) positioning via COT Index over the past 36 months. Traders can isolate periods of extreme positioning to identify the start or end of a trending environment.
In Build Alpha, traders can test any COT Index value or range of values from the point-and-click interface. Here’s a sample strategy that goes long $10,000 per trade in QQQ (Nasdaq ETF) when Nasdaq futures non-commercials COT Index is less than or equal to 50. Simply being long QQQ when large speculators are less bullish (blue line) has drastically outperformed QQQ buy and hold (red line) over the past 20 years.

This signal can of course be improved by requiring this signal and having Build Alpha search thousands of other signals to find complimentary filters.
Simpler COT Trading Signals
The simplest COT trading signal is to look at the net position – subtract the shorts from the longs – so that a positive number means that particular category of trader is net long and a negative number means that category of trader is net short. If the net position is zero, long and short traders’ positions reported equal each other. It is common when there is no underlying bias or directional sentiment that traders hold positions equal to each other or close to it.
Further, we can then divide the net number by the total open interest to express a normalized value that can provide apples to apples comparisons over time or across markets. A value of -0.20 would be a 20% net position or 20% of open interest is positioned short.

COT Report Trading Signals in Build Alpha
Build Alpha has COT data back to 2000 included in the 5,000+ built-in signal library. You can search for them in the top filter using “COT” as pictured below.
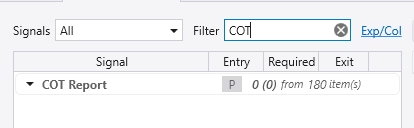
These signals can be used for entries, exits or general strategy filters. Build Alpha has COT data for the following markets:
- S&P500
- Nasdaq
- Dow Jones
- Vix Futures
- AUDUSD
- Dollar Index
- EURUSD
- 2-Year Note Interest Rates
- 5-Year Note Interest Rates
- 10-Year Note Interest Rates
- 30-Year Bond Interest Rates
- Natural Gas
- WTI Oil
- Silver
COT Report Trading Strategy Example
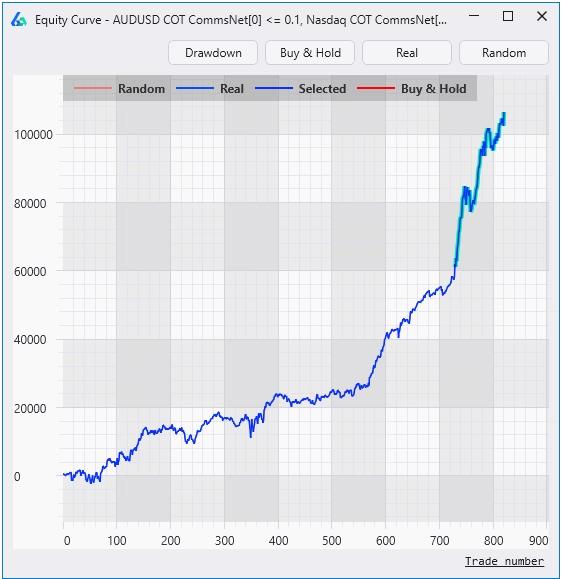
Index traders take a look at this one! This simple SP500 futures market strategy demonstration was built using Build Alpha’s COT signals. I only used the COT signals and did not use any other price, volume or non-price based entry or exit signals. This strategy enters whenever the following is true:
- Nasdaq Commercials Net positioning 15% or less of open interest
- Five-Year Note Commercials Net positioning 15% or less of open interest
- AUDUSD Commercials Net positioning 10% or less of open interest
The strategy simply exits after one bar. Its performance below is from 2007 through 2023 using only one contract per trade.
COT Indicator or Filter
A better use of non-price data like COT report or other sentiment data is often to use the data as a filter to a price action or price and volume-based strategy. Price strategies often lack context about the market environment and as we all know patterns and signals act differently in different market conditions.
COT data and other non-price based data acts as a way to relay information about the environment to our trading systems.
Below is a simple example of how to find or improve a simple price action strategy with COT report data as a filter using the required signal functionality in Build Alpha.
Cool Ideas for using COT Data with BA
You can pair COT data with economic news events. For instance, perhaps it is only worth trading a news event when smart money is in the same direction. Perhaps intraday trading systems could benefit from a filter from larger players.
Summary
The Commitment of Traders COT Report is a weekly report released by the Commodity Futures Trading Commission which discloses open interest and market positioning in futures markets and options on futures markets for three different types of traders: Commercials (hedgers), non-commercials (large speculators), and nonreportable speculative traders (small trader).
The data gives insights into how market participants are positioning for future trends and give an asset manager or commercial traders an idea on market timing or pending market pressure. The report is released Friday but only contains data up until Tuesday.
Traders reports and other non-price-based data can be valuable contextual information to relay market environment or regime details to automated trading strategies. Build Alpha now contains COT report data for 15+ futures markets that can be used to create automated trading strategies without any coding.
Author

David Bergstrom – the guy behind Build Alpha. I have spent a decade-plus in the professional trading world working as a market maker and quantitative strategy developer at a high frequency trading firm with a Chicago Mercantile Exchange (CME) seat, consulting for Hedge Funds, Commodity Trading Advisors (CTAs), Family Offices and Registered Investment Advisors (RIAs). I am a self-taught programmer utilizing C++, C# and python with a statistics background specializing in data science, machine learning and trading strategy development. I have been featured on Chatwithtraders.com, Bettersystemtrader.com, Desiretotrade.com, Quantocracy, Traderlife.com, Seeitmarket.com, Benzinga, TradeStation, NinjaTrader and more. Most of my experience has led me to a series of repeatable processes to find, create, test and implement algorithmic trading ideas in a robust manner. Build Alpha is the culmination of this process from start to finish. Please reach out to me directly at any time.