E-Ratio
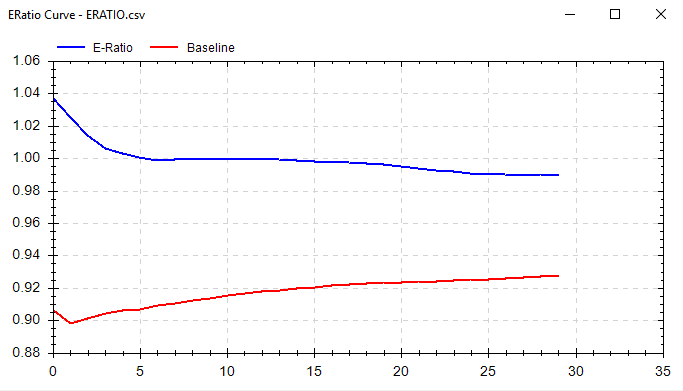
Edge Ratio or E-Ratio measures how much a trade goes in your favor vs. how much a trade goes against you. The x-axis is the number of bars since the trading signal. A higher y-value signifies more “edge” at that step in time.
Measurements are normalized for volatility; this allows us to use e-ratio across all markets and regimes. Once normalized for volatility, 1 signifies that we have equal amounts of favorable movement compared to adverse movement.
In other words, the y-axis is an expression of how many units of volatility more or against you your trade gets. A measure of 1.2 would indicate .2 units more of favorable volatility and a measure of 0.8 would indicate .2 units more of adverse movement.
The blue line is for the selected strategy’s signal and the red line is for a “random” strategy for the same market. The red line is to serve as a baseline to beat. Ideally, you’ll want to see a blue line above 1 and above the random line.
You may find many “good” strategies, but they may have an E-Ratio less than the red baseline or less than one. This would make us less confident that our signal will withstand the test of time.
Additionally, if E-Ratio falls off a cliff at bar 6… then it probably does not make sense to hold for 15 bars!
Another tool to make sure Build Alpha + Trader = Success.
How to calculate:
- Record Maximum Adverse Excursion and Maximum Favorable Excursion at each time step since signal.
- Normalize MAE and MFE for volatility. To compare across markets we need a common denominator. Let’s use ATR or a unit of volatility.
- Average all MFE and MAE values. Now you should have average MFE and average MAE at 1 bar since signal. Average MFE and average MAE at 2 bars since signal…
- Divide Average MFE by Average MAE at each time step.
Example. Calculate E-Ratio at one bar out from signal.
Signal 1:
MFE 1.50 ATR 1.27
MAE 1.00 ATR 1.27
Signal 2:
MFE 1.33 ATR 1.19
MAE 1.04 ATR 1.19
Signal 3:
MFE 1.83 ATR 1.67
MAE 1.27 ATR 1.67
Average MFE = ((1.50/1.27)+(1.33/1.19)+(1.83/1.67))/3 = 1.13
Average MAE = ((1.00/1.27)+(1.04/1.19)+(1.27/1.67))/3 = 0.81
E-Ratio at Bar One = 1.13/0.81 = 1.395
So in this example, one bar after our signal, we can expect ~.40 more units of volatility in our favor than against us. In other words, if ATR is 20 points then we can expect the trade to move on average 8 points (8/20 = .4) more in our favor than against us 1 bar after the signal is generated.
** Update **
I spoke quite a bit about E-Ratio or Edge Ratio in a recent podcast interview with Andrew over at BetterSystemTrader.com/79
Please check it out and let me know what you think. Thanks.
Thanks for reading,
Dave