Build Alpha

How to Build an Automated Trading System
In Excel, Python, and Build Alpha

It is no secret that many traders fail to achieve success and a level of consistency. The persistent traders will eventually understand they need to quantify what their edge is. This inevitably leads them down the road of systematic or quantitative trading but with no direction on how to begin. 

I am often asked how to build an automated trading system or how to create a trading algorithm or become a software trader. In this post, I will walk through testing a simple two rule system for the SP500 using Excel, Python and Build Alpha. The goal is to show how simple investigating quantifiable edges can be. 

I will use the same simple trading algo idea in all three platforms to hopefully show some algo trading 101 level steps in each platform. The strategy will buy when IBR (defined later) is less than 20 and the closing price is below the 10 period simple moving average. It will hold for 1 day and will not have any position sizing or risk management. Very simple to create.

We will also create visuals for the equity curve (P&L graph) and drawdown.

How to Create a Trading Algo in Excel

Starting with excel makes the most sense as the majority will be most familiar with it. I will share many screenshots and explain the steps one by one on how to do backtesting in excel. This is a simple example – no risk management stock trading excel example yet. So if you are an excel expert this may feel like a slow walk in the park – that is by design!

Step 1: Open the data file in Excel. Finance data is almost always going to be displayed in this format of Date, Time, Open, High, Low, Close, Volume (and Open Interest if futures or options). It is often referred to as OHLCV data. 

Excel0

Step 2: Calculate IBR or Interbar Rank. This is sometimes referred to as IBS or Interbar strength. It is a 1 period stochastics where we view where the close is in relation to the bar’s trading range. An IBR of 20% or lower would mean the close was in the lower 20% of the bar’s range.

The formula is simple and can be seen below. It is the difference between the close and the low of the bar divided by the range of the bar. Please note I added 0.0001 to the denominator to avoid any divide by 0 errors when/if the high and low are equal to each other. I have also multiplied IBR by 100 in order to express it as a percent.

After typing in the formula, drag this value down for all rows of data in order to calculate the IBR for each bar.

Step 3: Calculate the 10 period Simple Moving Average. Go down to the 10th bar and add the formula below. Drag this down for all rows of data to calculate the 10SMA for each bar.

Excel0

Step 4: Let’s add a new column and calculate our 10 period SMA signal. I have named this column Signal1. We will check if the current close is below the current SMA.

In order to check this, we can use an excel if statement. If the close is below the SMA return a 1 else return a 0. 

Excel3

Step 5: Adding another column named Signal2 in order to calculate our IBR signal. Again using an if statement to check if the current IBR is less than or equal to 20%. That is, if the current bar’s IBR is less than 20% return a 1 else return a 0.

Step 6: We need to combine our two signals into one signal. That is, whenever we close below the 10 SMA and have a weak close in the bottom 20% of the day’s range we want to return a 1 otherwise return a 0. A 1 would mean a green light to trade and a 0 would sit us on the sidelines as we have no edge.

All we need to do is check the sum of the previous two columns we created. If their sum is 2 then we return a 1 else we return a 0.

Step 7: Next let’s calculate the raw one day returns on the SP500. We have been using the closing price in all of our signals so we cannot truly know if our signal(s) are true until the close of the bar. Thus we cannot enter until the next bar’s open. 

Let’s assume we get a true signal on Monday’s close. We would then enter on Tuesday’s open and hold for one bar exiting on Wednesday’s open. We could exit on Tuesday’s close but for simplicity’s sake we won’t in this example.

Our excel function checks if we have data the next two days by checking if the opening price is non-zero and exists. If we have data, we can then subtract tomorrow’s open from from the open of two days from now. That is, take the difference of Wednesday and Tuesday’s opens per our example and store it in Monday’s row.

This gives us a data column that says, if we have a signal on this bar and buy the next open, hold for one day, what would our return be?

Step 8: Now let’s get our trade returns. If we have an actual signal in our ‘SignalFinal’ column from our two indicators what would our return be. 

I also multiplied by 50 to represent the point value of the SP500 emini futures contract. That is, if you buy at 3346 and sell at 3347 then you’ve earned $50 per contract not $1 per contract. Each futures contract has a point value and this one’s is 50.

Excel7

Step 9: Let’s copy our Date column and Trades column into a new tab. I clicked on the ‘A’ above ‘Date’ to highlight the entire column. I then hold ctrl and click on the ‘O’ above the ‘Trades’ column. This should highlight both columns.

Press ctrl + c to copy. Open a new tab and press ctrl + v to paste.

Step 10: Let’s do some house-keeping to remove the days we did not trade. We first need to sort by our Trade column and delete all days with “—” in the cell.

After deleting non-trade days, I then re-sort by date from oldest to newest.

To sort please highlight the columns, go to the data menu and select sort. 

Excel12
Excel0

Step 11: Time to create our P&L Graph. We need to add each trade value to a rolling sum of all trade values. The simple formula is below.

Drag this formula down to calculate the equity curve’s value after each trade.

Excel12

Step 12: In order to calculate the drawdown of our simple trading program we need to first calculate the high watermark or the rolling maximum amount our account would have achieved following this simple trading system.

Once we have the maximum or high watermark, we can then subtract our current P&L from the maximum to determine the current drawdown. I have added new columns for the maximum P&L (MAX) and the Drawdown (DD).

Excel0
Excel0

Step 13: Now we can plot our P&L Graph and Drawdown. Simply highlight the column, go to the Insert menu and select a line chart.

Excel0

How to Build a Trading Algo in Python

I have done a few other blogs on how to read a text file in python and using pandas but this example will show not only how to read in data, but how to complete all the steps above in one simple python script. The goal is building trading algorithms with python – or at least the first steps.

That way you have a very rudimentary framework for testing automated trading systems and creating trading algos in python. Hopefully this serves as an intro example of how to backtest a trading program or strategy.

Step 1: Create a new file, import our plotting library and pandas. Matplotlib is arguably the most popular python visualization library.

In the pandas read_csv call I have specified the file I’d like to read in, how to separate my columns, and what column should be the index of my pandas dataframe. 

Step 2: Let’s calculate our indicators. To calculate IBR we will use list comprehension which is a very cool python trick. It allows us to do a for loop over our entire dataframe all in one line of code. The calculation is the same as excel and will create a dataframe column named IBR as we had in excel.

We will then use the pandas rolling function to create our 10 period simple moving average (mean). I have saved our moving average values in a new dataframe column named ‘SMA’ similar to excel.

Step 3: Following similar steps as we did in excel, we can convert our indicators into actionable signals using ‘if’ logic. We will use python’s list comprehension feature which allows us to loop through our entire dataframe in a single line of code.

For instance, we will create a new dataframe column named Signal1 which will store either a 1 if IBR is less than 20 or a 0 if it is not less than 20.

Step 4: Similar to excel’s footsteps let’s continue creating our python trading algo by calculating the returns and then mapping our returns and signals into actual trade results.

First, we can use pandas built-in shift function to access tomorrow’s opening price and the opening price from two day’s from now. This is similar to how we calculated returns in excel.

To create the trade results, we need to know if there was a signal or not. We can multiply our SignalF column and our return column. If we have a signal we will have a trading return and if we do not have a signal (0) then the return will get zeroed out. I’ve also multiplied by 50 to account for the SP500 emini future contract’s point value to convert our Trades into actual dollar values for 1 contract.

Step 5: In excel we had to copy and paste our trade returns into a new tab, sort them, remove days we did not trade, etc. In Python we can simply create a new pandas dataframe, named Trades, and filter our original dataframe. We will simply return only the rows of our original dataframe where our signal was equal to 1. That is, only returning the values when we took a trade.

Step 6: To calculate our P&L and drawdown we can use the following two simple lines of code. Since our P&L is simply the cumulative sum of our trades we can easily just call the cumsum function on our Trades column. 

In order to calculate the drawdown we can just subtract our current P&L from the rolling cumulative maximum P&L. Python and pandas has a built-in cummax function we can use which will save us from creating an additional column to store our maximum values (high watermarks). This means one less column than excel.

Step 7: Plotting in python is simple. We already imported matplotlib – our plotting library – in the first step of this python walk through. Now we can call the pandas plot function, specify that we want to use subplots, and then display our plot with the show function.

How to Build a Trading Algo in Build Alpha

Step 1: Configure Build Alpha’s main screen. Set the symbol to ES which is the symbol for the SP500 emini futures contract.

Set the date range to start in 1997 and end near Sep 2020 to match the same data used in excel and python.

In the lower left set the max holding time to 1 bar in order to again match excel and python.

Step 2: Let’s select our signals. Type IBR into the ‘Filter’ search bar near the top. Scroll down and select the signal IBR <= 20 as an ‘Entry’.

Then type in SMA in the ‘Filter’ search bar near the top. Scroll down until you find the signal Close <= SMA(10). Select this signal as an ‘Entry’. 

Then hit Simulate!

Step 3: In the Results window you will view our two rule strategy at the top (highlighted in blue). Double click on the strategy to view the P&L graph. Toggle drawdown off and on by hitting the drawdown button.

What's Next?

Some logical next questions might be how can I add a stop? How can I add more signals? How can I trade automated strategies after I’ve tested in excel or python? I encourage you to try adding on to this simple trading program idea in both excel and python. Then there can be a greater appreciation for how simple Build Alpha can make things!

Want to add a stop? Click a button. Want to add a signal? Click a button.

I am often asked how to build automated trading systems or how to create automated trading systems in excel or what is the best automated trading software and what software do professional traders use, etc. This blog post and the rest of the Build Alpha blog can answer those questions. The information is out there, the tools are out there.

Trading is not easy, but it is simple. Hunt for edges, collect them, execute them.

If you want access to the python script or the excel sheet please send me an email at david@buildalpha.com.

Other Build Alpha Python Resources

Author

David Bergstrom Author Photo Trading Edge

David Bergstrom – the guy behind Build Alpha. I have spent a decade-plus in the professional trading world working as a market maker and quantitative strategy developer at a high frequency trading firm with a Chicago Mercantile Exchange (CME) seat, consulting for Hedge Funds, Commodity Trading Advisors (CTAs), Family Offices and Registered Investment Advisors (RIAs). I am a self-taught programmer utilizing C++, C# and python with a statistics background specializing in data science, machine learning and trading strategy development. I have been featured on Chatwithtraders.com, Bettersystemtrader.com, Desiretotrade.com, Quantocracy, Traderlife.com, Seeitmarket.com, Benzinga, TradeStation, NinjaTrader and more. Most of my experience has led me to a series of repeatable processes to find, create, test and implement algorithmic trading ideas in a robust manner. Build Alpha is the culmination of this process from start to finish. Please reach out to me directly at any time.

Intraday Edge: Find strategies backwards

The Goal of Intraday Trading

A large consideration of developing trading systems should be how efficient our capital is working for us. The quicker we can realize profits, the more trades we can make thus allowing our capital to compound more quickly. Additionally, sitting in positions for long periods increases our risk to extraneous events.

On the other hand, it is typically easier to find daily or higher timeframe edges than intraday edges due to the increased noise in intraday data.

From Daily to Intraday?

Is there a way to reduce the time in a position which would increase our trade count (via number of strategies) which would then allow us to arrive at the law of large numbers more quickly and therefore allow our capital to compound more quickly?

Yep. One of the new features in Build Alpha, called “Intraday Edge”, is a tool which allows us to do exactly that. Intraday Edge allows us to dig deeper into daily trading strategies to see if we can make them more efficient by reducing their holding times into smaller intraday time windows.

Maybe we can capture most of the daily strategy’s edge during only a small portion of the typical holding time. That’s right.. turning daily strategies into intraday strategies.

Intraday Edge Trading Example

First, let’s take an original daily trading system to examine the power of this new feature. I will use a simple one rule strategy that:

  • SP500 Futures Contract
  • Long Only
  • Buy when close in bottom 20% of day’s range (IBR or internal bar strength in Build Alpha)
  • Exit 1 day later

This assumes about a 23 hour risk (i.e., one Globex trading session).

Intraday Improvement

However, what if we could dig into this strategy and realize that most of the gains only come from 1 am EST to 4 am EST? We can then reduce our holding time by about 87% which now only ties up our capital for 3 hours as opposed to 23! This gives us an additional 20 hours to utilize other strategies to continue to grow our capital while still capturing a large portion of the original daily strategy’s edge.

Imagine we only had enough capital for one strategy. This Intraday Edge feature can now make our capital work much harder by finding intraday edge strategies for multiple markets/times of the day. Tying up capital for 23 hours in one daily strategy vs. trading 7 different intraday edge strategies with the same capital.

*Original strategy can be reduced by Intraday Edge which allows other intraday strategies to be traded with the same capital that was orignially tied up by the daily strategy*

In the end, it makes our once daily system much more efficient. Check out the performance metrics of the original daily system compared to the new “Intraday Edge” version.

*Daily Strategy*
*Intraday Edge*

Steps in Build Alpha

So how can this be accomplished in Build Alpha? It is simple.

  1. Highlight any daily strategy
  2. Click the Test Settings in the bottom right to configure the intraday timeframe you want to use
  3. Hit the Intraday Edge button

Build Alpha will then search all possible holding periods within the original strategy’s trading duration to see if there is a more efficient version with reduced holding times. You can include the original strategy’s exit criteria such as stops, etc. or choose to exclude them. Flexibility to test everything is always key in Build Alpha.

Additional Uses of Intraday Edge Feature

Intraday Edge can even be used on different markets at the same time. For example, imagine an original system built on Gold daily bars but then we search for an intraday edge version that trades oil but only during this specific 2 hour window while the original Gold System has an active signal.

This Intraday Edge feature essentially allows us to search for intraday and multi-timeframe strategies in a new way. In this above Gold and Oil example we have a multi-timeframe AND intermarket strategy created from a simple Gold daily strategy.

You can still search for multi-timeframe and intraday strategies in the original/traditional way. That is, just searching the intraday data from the start. However, it is often faster and easier to find daily strategies then work them into intraday ones. At least now with Build Alpha you have the option to search both ways. Something not possible elsewhere.

Automating Intraday Edge Trading Strategies

And of course, all of the adjustments from the Intraday Edge feature are then applied to the code generators so you can automate these Intraday Edge systems with one click as with everything.

As always, I will keep attempting to add flexibility and ways to dig deeper so we can have the best trading strategies possible. Leave no stone unturned and test everything!

Thanks for reading,

David

Noise Test Parameter Optimization

In short, this is a new feature that allows us to optimize strategies across noise adjusted data series as opposed to the traditional method of optimization which only optimizes across the single historical price series. Here is a reminder on the Noise Test.

The problem we face is the historical data is merely only one possible path of what *could* have happened. We need to prepare ourselves for the probable future not the certain past. In order to do this, we can generate synthetic price series that have altered amounts of noise/volatility than the actual historical data. This provides us with a rough sample of some alternate realities and potentially what can happen going forward. This is the exact type of data that can help us build more robust strategies that can succeed across whatever the market throws at us – which is our end goal in all of this, right?

Noise Test Trading Strategy Example

Let’s look at a Noise Test Parameter Optimization (NTO) case study to show exactly how it works…

I have built a strategy from 2004 to 2016 that does quite well. The strategy’s performance over this period is shown below…

BuildAlpha NTOoriginal

Now, if we right click on the strategy and select optimize, we can generate a sensitivity graph that shows how our strategy performs as we alter some parameters. This is done on the original historical price data with no noise adjusted data samples added (yet).  We simply retrade different variations of parameter settings on the single historical price data and plot the respective performances. This is how most platforms allow you to optimize parameters and I want to show how misleading it can be to traders. The rule I’ve optimized had original parameter values of X = 9 and Y = 4 (black arrow). The sensitivity graph is shown below. Each plot consists of three points: parameter 1, parameter 2 and the resulting profit.

BuildAlpha Original Annotated Optimization

We can see the original parameters are near a “sensitive area” on the surface where performance degrades in the surrounding areas. Performance drops pretty hard near our original strategy’s parameters which means slight alterations to the future price data’s characteristics can degrade our strategy’s performance quite a bit. Not what we want at all and, as we all know, there will be alterations to future price’s characteristics! How many times has a backtest not matched live results? Perhaps more robust parameter selection can help…

Parameter Selection

The more robust selection using the typical simple optimization method on the historical data shows we should probably pick a parameter more near X = 8 and Y = 8 (pictured arrow below). This is the traditional method taught in textbooks, trading blogs, etc. We optimize on the single historical data then find a flat/non-peaked area close to our original parameters and use those new parameters.

BuildAlpha Where We Should Have Been

NTO Parameter Selection

However, if we run Build Alpha’s Noise Test Optimization with up to 50% noise alterations and 50 data samples (green box below), we see a much different picture. What this does is, instead of optimizing on one historical path we now optimize across the one historical path AND 50 noise altered data series. The sensitivity graph shows a much different picture when optimized across the 51 data series. We are less concerned with the total profit and loss but rather the shape of the surface…

BuildAlpha NTO Improves

The Noise Test Optimization (NTO) shows we should actually pick values of X = 8 and Y = 2 (arrow above). This area actually outperforms the ‘robust’ area from the traditional simple one data set optimization that most other platforms and textbooks show. In other words, I am comfortable picking a peaked area of the surface from the NTO results because the peak is true across noise adjusted values and not just a single price series. Secondly, if we fall off this peak then we are still at (or near) the highest level relative to the rest of the surface.

Forward Results

Looking at how all three of these parameter selections performed from 2016-2020 can be quite telling…

BuildAlpha Original Equity Curve
*Original Parameters 2016-2020*
BuildAlpha Traditional Equity Curve
*Textbook Parameter Selection 2016-2020*
*NTO Parameters 2016-2020*

The Noise Test Optimization (NTO) returned about $20,000 more profit per contract than the other two methods in this hypothetical case study or about 33% more profit over the same 2016-2020 period. These small adjustments to commonly misused tests can really make a large difference when spread across a portfolio of strategies. It is time to stop using outdated tools. I am not saying each strategy will show NTO results like this, but failing to check is a compounding mistake few of us can afford to make.

Build Alpha also possesses the ability to optimize parameters across a basket of symbols (and their noise adjusted data as well). For example, build a strategy for SPY but optimize it across SPY, QQQ, IWM and DIA.

As always, thanks for reading

David

Another Success Story [trader turnaround story]

I am back! I want to share another Build Alpha success story with you guys for a few reasons. First, I have been very quiet on social media, etc. lately and that is because I do not need to promote Build Alpha every day (although I probably should). I haven’t tweeted in month(s), but I have maintained my typical support, however. Anyways, think twice about traders that push their service, product, software, etc. every single day – it means they rely on it. Secondly, this Build Alpha user is the EXACT reason why I started on this journey of making Build Alpha publically available. His story also echoes my own – which is why I am so fascinated by it and could not resist sharing it with everyone.

First, let me reiterate my main goal with Build Alpha, the one written on the homepage of the site  since day one: “Bridge the gap between the programming world, the quantitative trading world, and the money manager/trader who seeks to evolve with the times.”

In other words, can I take someone with no programming/trading experience and help turn them into a successful systematic trader? That is what I set out to do. I know the depths of the trader struggle and I want to pull as many traders as I can from that pain.. because man, do I still remember it like it was yesterday!

I do not wish to teach programming or wish to give you some PhD in statistics/finance, etc. My main goal was to create a tool to bring a trader who is completely unexposed (or partially unexposed) to algorithmic trading the ability to create their own portfolio of strategies, understand how pros think about risk, AND automate these strategies  all without ANY programming. That is, take someone from no programming experience to algo trading profits without any programming.

The trader who I am talking about wishes to remain nameless (for now) and I will refer to him as TraderX. His email to me and account statement are below.

Testimonial Disclosure:  Testimonials appearing on this website may not be representative of other clients or customers and is not a guarantee of future performance or success.

*click to zoom*

His story is eloquently explained in his email as only a trader experiencing the full journey could. I’ve only summarized his highlights for convenience, but his words are better.

Highlights

  • +$34,000 in one month, trading small size across a diverse basket of  markets, timeframes.
  • Started learning from online sources and not formally educated by any big bank, business school, etc. with regard to trading. Takeaway: Self-taught is possible!
  • Payed for educators and services, alerts, chat rooms with mixed to negative results. Takeaway: there are no shortcuts in this game.
  • Went ALL-IN on learning and understanding BuildAlpha and its training videos. Takeaway: Build Alpha is a tool, but ultimately the end user is  responsible for his/her own success with it.
  • No desire to program and still does not care to learn… because he does not need to. Takeaway: tools needed to succeed exist in BA
  • Diversified his portfolio across assets/symbols, timeframes, strategy types, etc. Takeaway: no holy grail hunting, but only professional portfolio building.
  • Understands how to set expectations and let systems play out. Takeaway: zero to hero. Simplicity usually wins.

TraderX is a great case study because he was  literally the struggling/learning trader I can relate to from my own experiences and watching/talking to him now with his evolved understanding of trading is truly incredible and cannot wish this success to a more deserving trader. The answer is simple: admit where you are, agree to put the work in, watch the videos, do the work, be patient. This is a general recipe for success in life – TraderX only got into trading after selling his own business. Some people just get it… others need to hear it first; that is why I do these posts. The answers are certainly there and exist!

I normally hate publishing these testimonials but am glad to have explained why I do. The results are simply the byproduct of great workflow/process learned through hardwork, Build Alpha training videos and experimenting. TraderX is not alone in the BA community in this regard. Here is another user’s statements over the past few months where you can see successful trading. He is taking his time, abiding by the numbers/expectations he’s created and ultimately growing himself and his account. Remarkable.

*click to zoom – had to cut his original image into two images so some overlap between*

To learn more, please contact me at david@buildalpha.com. Reminder: Build Alpha comes with 50+ training videos where I explain system trading principles, system trading basic, and of course the details of how to maximize the Build Alpha software.

Thanks for reading,

David

Testimonial Disclosure:  Testimonials appearing on this website may not be representative of other clients or customers and is not a guarantee of future performance or success. To view full risk disclosures please visit Disclaimers – Build Alpha

Testing Across Markets, Trigger Signals, Signal Breakdown [New Update]

I wanted to give this latest version of BuildAlpha its own blog post as there are a few features that deserve a more thorough explanation to fully understand their power. I will highlight three of these new features below.

1. Testing Across Markets

The latest version allows the trader/money manager to develop strategies across a basket of instruments as opposed to just one symbol. For example, one can select Gold, Oil, SP500 and 30 Year Bonds (as well as thousands of signals at once) and the software will find the best strategies based on the combined performance across the selected instruments. You can also build trading strategies that are trained on various timeframes at once. For example, a basket can consist of 30 minute data, 240 minute data and daily data and the software will find the strategies that work best across all these timeframes. I first mentioned this technique of testing across markets to reduce the chances of curve-fitting in this blog here: https://buildalpha.com/3-simple-ways-to-reduce-the-risk-of-curve-fitting/

Testing across markets (and/or timeframes) is a great way to find robust strategies that generalize well and help to combat over-fitting. If you don’t believe me, take Jaffray Woodriff’s word for it. Woodriff, the founder of $3 Billion Quantitative Investment Management, was recently in the news for his $120M (yes, million) donation to the University of Virginia’s data department. In the book Hedge Fund Market Wizards, Woodriff was asked what changed from his early years when he was slightly down for two straight years to when he made over 80% in just the first six months of the following year. Here is his response straight from the book

“I started to figure out that the more data I used to train the models, the better the performance. I found that using the same models across multiple markets provided a far more robust approach. So the big change that occurred during this period was moving from separate models for each market to common models applied across all markets.” Pg. 146

Furthermore, if (when) the market changes then strategies built on multiple (and even better, diverse) markets should stand a better chance of surviving as they’ve been built across different data sets.

Build Alpha now makes it incredibly simple to build and test ideas and strategies across multiple markets at once. Just select one or as many markets as you prefer from the drop down menu and Build Alpha will return the results of the strongest strategies built across the entire basket. The ability to analyze the aggregated results as a basket as well as analyze the individual components is extremely simple.

The top row is the aggregate performance of the entire basket denoted by the symbol ‘BSK’. If you click the top left arrow it will drop down the basket’s components with their respective indiviudal performance.

Note: I am not saying that single market models do not work! They most certainly do, and there are certainly players that only participate in specific markets thus creating idiosyncratic patterns and opportunities. Of course the BuildAlpha trader can still search for single market models in BA as well. Flexibility is always key!

2. Trigger Signals

A trigger signal is the combination of two rules or signals occurring within a specified time window. We assume the main signal is occurring right now and then require that the second signal – the trigger signal – had to occur at least once in the last N bars for the full combined signal to be valid.

A simple example is to consider these two signals

  1. Close crosses above the 20 period SMA (main)
  2. Close is below the lower Bollinger Band at any time in the last 5 bars (trigger)

If we cross above the 20 SMA today and at any point in the last 5 bars we also closed below the lower Bollinger Band then we have an active signal.

Adding a ‘trigger’ to a signal can greatly improve the edge of the main signal. I ran a simple test using the above Trigger Signal on a basket of securities (ES,NQ,US,SPY,QQQ,TLT) and viewed the combined E-Ratio.  The original main signal (with no trigger signal) is seemingly random with an aggregated E-Ratio of only 1.02. However, adding the trigger signal jumped the E-Ratio to 1.39 – a 36.27% improvement.

Additionally, the E-Ratio for the main signal when just considering the 30 Year Bond Futures (symbol US) improved about 100% from 1.05 to 1.92 with the addition of the trigger signal.

To create trigger signals simply go to File -> Custom Indicators and set type to Trigger. Here is an example of the above Trigger Signal:

And here is a visual (pink dot is a true signal with trigger and blue dot is a true signal without trigger)

More on these in future upgrades..

3. Signal Breakdown

The final new feature I want to discuss allows us to view EVERY signal Build Alpha has (currently 5000+) and the likelihood it occurs on our winning trades as well as the likelihood it occurs on our losing trades even if it is not included in our original strategy’s rules. Why is this helpful? Well this can give us insights into what signals, rules or filters we can add (or exclude) to improve a strategy.

For example, if you knew that a specific signal occurred on 75.32% of your winning trades and on only 14.75% of your losing trades would you want to include this rule in your strategy to see if it improves results? Of course.

Additionally, if you knew that a specific signal occurred on only 18.37% of your winning trades but on 84.69% of your losing trades would this not be a rule you’d want to exclude from your strategy – in other words, avoid trading when this rule is true as it appears only true on losing trades!

The Signal Breakdown can be a powerful tool to help improve, tweak and understand strategies. However, caution is advised to still follow proper testing procedures such as in and out of sample testing, etc. There are other posts regarding this matter.

Why doesn’t Build Alpha find these rules initially? It does, but the user also has the ability to limit the software to generate the best strategies only using a user specified maximum number of rules. If the user wants to later add an additional rule then using the Signal Breakdown can lend insights into which additional rule(s) to add.

As always, thanks for reading and your support. It means a lot.

Thanks,

Dave

Ensemble Strategies [Reduce Overfitting By Combining Strategies]

What is an Ensemble Method?

“In statistics and machine learning, ensemble methods use multiple learning algorithms (trading strategies in our case) to obtain better predictive performance than could be obtained from any of the constituent (individual strategies) learning algorithms.”

A simpler example would be to consider it as a voting system. Imagine 3 SPY strategies. In theory (and every individual case needs tested), if one strategy says long and the other two say flat (or short) then long is not a very confident position. On the other hand, if two or all three strategies say long then it is a more confident long entry.

It is also important to point out or imagine the market as a living breathing organism that is constantly evolving and dynamic in nature. So imagine having a strategy on Oil, Gold, Bonds and Stocks. Now you can get a better picture of what is happening in individual markets and how their combination or interaction can help predict what to do next in a stock index or the US dollar strategy, for example.

This is slightly different than intermarket strategies because intermarket strategies simply include ‘signals’ from secondary markets. Ensemble strategies are actually using the strategies themselves which undoubtedly carries more information than just the signals themselves.

Ensemble Strategies in the real-world and Finance

The first example, is about the Netflix challenge where Netflix offered a million dollar prize for the “best suggested movies to watch” algorithm. Jaffray Woodriff, founder and CEO of Quantitative Investment Management ($3B in AUM), competed in the contest and took 3rd! Woodriff is a big proponent of ensemble methods and mentions such in his Hedge Fund Market Wizards chapter of Jack Schwager’s great book. The team that actually won the contest was in a close race with the second-place team and wound up running away with the first-place prize by using an ensemble method applied to the other top 30 competitors’ models. I am trying to convey financially incentivized practicality here; the story comes from Ensemble Methods in Data Mining by Giovanni Seni and John Elder with a foreword by Jaffray Woodriff.

Ensemble Strategies and Trading

The two main things that plague trading strategies are

  1. Underfitting (bias)
  2. Overfitting (variance)

In the latest book sweeping the Quant world: Advances in Financial Machine Learning Ensemble Methods have their own dedicated chapter! In this chapter, the author Marcos Lopez de Prado (head of AQR’s machine learning division and formerly founded and led Guggenheim’s Quantitative Investment Strategies that had over $13B in assets) states,

“An ensemble method is a method that combines a set of [weak] learners… in order to create a [stronger] learner that performs better than any of the individual ones. Ensemble methods help reduce bias AND/OR variance”.

So ensemble methods can help reduce overfitting? That sounds desirable for every system trader I know!

Quick Ensemble Tips

  • Ensemble strategies will be better the more diverse the individual strategies. For example, use one strategy that looks at volume, one that looks at price action, and one that looks at spreads or intermarket signals.
  • Do not try and ensemble very poor individual strategies and expect miracle improvements. Simple ensemble methods such as bagging, cannot improve the accuracy of such poor systems. So, you still have to put effort in designing the individual strategies! Ensembling is not a shortcut that can turn dirt into gold; however, it can polish up some things very nicely.
  • Finally, ensembling (with bagging) is more likely to be successful in reducing variance (overfitting) than reducing bias (underfitting). This attacks the BIGGEST problem we have as system traders and developers.

Ensemble Strategies and Trading in Build Alpha

We can now select individual strategies that we want to use in the overall simulation. This means we can build strategies that only take a position when another strategy has an existing position. This is a great way to create hedging strategies (more on this in a later post/video).

The above ‘signal’ (if used) would only enter a trade when our strategy ‘SPY Strategy3 Trend’ has an existing position. This is a simple way to build hedgers, or use confirmation from other strong systems.

If you mark strategies in your Build Alpha portfolio as ‘Active’ then they can be used in ensemble strategies. The below selected signal would only enter a position when at least 2 (any 2 of your active strategies) already has a position. You can also select all the ‘at least’ signals and have the software find the best combinations of your existing strategies to use in an ensemble strategy.

Ensemble Trading Strategies and Hedging

This new feature in Build Alpha gives system traders an unique advantage never before offered. We can now create ensemble strategies at the click of a few buttons and completely automate them.

How Can I Make Ensemble Strategies Only Using The SPY Strategies?

If you have a few diverse strategies in your portfolio and want to create an ensemble only using a few of them then make sure the strategies you want to include in the ensemble are the only ones marked active in your portfolio. Below I’ve only marked the SPY strategies as active in my portfolio (left photo). Then when I select at least 2 on the right photo it means it will trade whenever at least 2 of the SPY strategies are in a position.

How Can I Make Ensemble Strategies Only Using The Non-SPY Strategies?

Simply change the active strategies in your portfolio by unselecting the SPY strategies and selecting the others.

How Can I Make Ensemble Strategies Using All The Strategies From My Portfolio?

You guessed it… just mark all as active. Now all strategies in our portfolio will be considered for ensemble strategies in Build Alpha’s strategy building process.

Note the above green box with the 1004 + 1000 numbers. This means that I have selected 1000 technical signals to use in the strategy building process plus 4 ensemble signals. I have also selected 1000 technical exit signals to include in the strategy building process. Now Build Alpha will create the best strategies it can given your inputs. You can also right click to ‘require’ any signal (including ensemble signals) to force the software to use that signal in the strategy building process.

Small Accounts

Ensemble strategies are great for smaller accounts too. If you cannot afford to trade multiple strategies, but have created a few then you can still capture the information of all the strategies by ensembling them into one ensemble strategy. Then you can trade this ‘master’ strategy with a smaller account than trading all the individual components. So better use of capital and less overfitting? Sounds good.

Ensembles: A Case Study

This is a simple case study showing the RSI2 strategy outlined in Larry Connors’s book Short-term Trading Strategies That Work. I have applied the strategy to the individual equity index ETFs and then shown the results of two different ensemble strategies of these four strategies applied to SPY.

The first ensemble strategy takes a position in SPY whenever two of the four individual RSI2 strategies have an existing position. It does not matter which two markets are trading at the moment, but it will trigger a SPY trade. This first ensemble strategy does better than three of the four individual components on most metrics, but specifically profit and loss to drawdown ratio.

Furthermore, if we look at the second ensemble strategy that only trades SPY when the RSI2 strategy has an active trade in all four of the equity indexes AND SPY is trading above its 200SMA then we can improve the profit and loss to drawdown ratio to over 10! Significantly better than any of the individual strategies.

Ensemble Methods Summary

Ensemble strategies combine multiple strategies to create a more powerful ‘master’ strategy. Ensemble strategies help reduce overfitting (curve fitting) which is the biggest plague us system traders and quant traders face. They have been shown in real-life trading, financially motivated contests, and as well as with large hedge funds to be superior to simpler trading strategies and machine learning models. BuildAlpha can now help you build, employ and automate ensemble strategies with a few clicks. Private videos for users now up!

2018 Year End Update

It is becoming more and more commonplace for large quantitative firms to use ensemble methods.

The future (and even the present) of quantitative finance is the discovery and deployment of ensembles of many marginal edges – even weak predictors. These smaller edges will not attract academic or practitioner interest because they may not be sufficiently profitable on their own, but combined in an ensemble can be very powerful. It is even believed Renaissance Technologies had this breakthrough a while ago and that has manifested/propelled them into the greatest Hedge Fund of all time.

A small and anecdotal example is the year end performance of this popularized RSI2 trading strategy. The individual strategy ran on the single markets resulted in

  • SPY -$17.5 per share traded
  • DIA +$0.24 per share traded
  • QQQ -$1.07 per share traded
  • IWM -$20.50 per share traded
  • Ensemble +$2.79 per share traded

An overall weak year for this strategy, but improved by the ensembling described above. Ensembles are just another tool in our arsenal with Build Alpha to build the trading portfolio we need! Cheers guys.

Thanks for reading,

Dave

A Strategy For Each Day of the Week [Seriously?]

A different strategy for each day of the week? Sounds crazy, but is it?

I have wrote about “Turnaround Tuesday” before.

This simple strategy is actually at new highs since this was published over 10 months ago!

But what about other markets? Is it possible to just trade one market per day of the week (from open to next day’s open) on a specific day of the week and still do well? If you would have followed this simple “portfolio” below for the past 15+ years then yes.. you would have.  You wouldn’t even of had to sit in front of the screens like the rest of us degenerates..

Strategy 1: Short Crude Oil on Mondays

Simple strategy dating back to 2003. Short Oil on Monday’s open and cover on Tuesday’s open. Results based on a 1 lot.

Strategy 2: Turn Around Tuesday

If Monday was a down day (Monday’s close less than or equal to Monday’s open) then buy Tuesday’s open and sell on Wednesday’s open. Results based on 1 lot.

Strategy 3: Long Gold on Friday's. Weekend Risk.

Maybe in lieu or anticipation of bad weekend news releases, buying Gold on Friday’s open and holding over the weekend to exit on Monday’s open has produced the following based on 1 lot.

Portfolio of Strategies

Not a bad portfolio equity curve, right?! One of the hidden ‘holy grails’ in trading is combining systems together to smooth the equity growth of the account. No one single super star out of any of these 3 strategies but combined their curve starts to look rather nice.

Utilizing Build Alpha for Seasonal Edges

Sure these might not be alpha generators on their own but maybe they can be combined with some other price patterns, filters or targets and stops to become full strategies. They can certainly act as intermarket or multi-time frame filters for more complicated strategies.

For example, if you have a 60-minute mean reverting system that buys oil dips then maybe it should be turned OFF on Mondays! At the very least it is worth a look, and this is all made very simple with Build Alpha – just point, click, test.

Odd vs Even Days

For example, did you know S&P500 has performed much better on even days than odd days? (April 6 is an even day).

Takeaways

Anyway, I just wanted to show some simple things that can be tested in Build Alpha and how sometimes the simplest ideas turn out to work the longest. Maybe because people think they’re too simple and that they can’t work? I don’t know.

Either way I have put some python code (and TradeStation code) in the private Build Alpha users’ forum to specify day of the week as I know a lot of you are trying to learn python so I figured I’d help out a bit. But day of week is all point and click options pre-built into Build Alpha’s signal library for those of you who could care less about learning to code! Build Alpha has support for various seasonal filters such as:

  • Day of week
  • Day of week combos
  • Trading Day of Week
  • Trading Day of the Month
  • Trading Days Left in the Month
  • Trading Day of Quarter
  • Trading Day of Year
  • Month
  • Quarter
  • Even or Odd
  • and More

Happy Friday.

Cheers fellas,

Dave

Three Trading "Truths" Quantified

I want to discuss three trading “truths” that I often heard but when I finally got into testing ideas found them to be myths. These discoveries were instrumental in turning my trading around.

For those that know my story, it was not all roses and rainbows – what trading story is?!? I actually “learned” like a lot of traders from online sources, chat rooms, webinars, and eventually found the right circles to roam in after a LOT of trial and error. I was then lucky enough to land a job with a high frequency trading firm. I was quickly made to realized that much of what I thought trading “was” was most certainly false.

In an attempt to show me the light, a few of the quick trading axioms they wanted to disprove to me were simple “well known” trading ideas that have been around for years but were in fact large falsehoods. I quickly realized beyond this list of three examples there must have been many, many more “trading truths” that were causing my account harm and doing my trading aspirations a disservice.

I then realized the value in testing everything and quantifying my entire approach. It wasn’t until this point in my journey did I get out of the “rat race” of trading… the ups and downs, the barely consistent, always doing slightly better but not really getting anywhere trading most of the traders I meet today are going through.

I cannot stress the importance of testing everything and quantifying your trading edge. Investigate these trading axioms. Otherwise, you will be stuck in randomness until your account random walks to 0. For more on my journey check out this podcast I did chatwithtraders.com/103 

Below you will find my three favorite trading “truths” quantified.

Trading “Truth” #1 - Bearish Engulfing Candle

This one is great because many are familiar with Japanese candle stick patterns and the name implies such a negative move in price that one cannot help but to shift their bias to the downside. These candlestick patterns are often traders first introduction to technical analysis.

The pattern is defined as a bearish candle that “engulfs” the range of the previous day. I also like to look for a negative close and preferably a close below the previous session’s low. Here are a few pictures of bearish engulfing candles.

The truth is that this pattern has been one of the most bullish (not bearish) one day signals for the SP 500 over the past 15+ years. Did you know that the day following a bearish engulfing candle actually closes higher 61.72% of the time in the SP500 futures and 65.33% of the time in SPY ETF? The day following a bullish engulfing candle only closes higher 54.05% of the time in the SP500 futures and 51.70% of the time in SPY. You tell me why they’re named how they are!

Trading Truth #2 – Above a moving average is bullish and below is bearish

Most of the time this is true but it depends on the moving average, moving average length, and the market. I recently came across a few blogs that mentioned using a short term moving average as a sign to exit long market exposure and wait for sunnier days. In reality, this sounds great; however, analyzing the data this can be an extremely misleading “truth”.

Below is a chart plotting the equity curve if you would buy every close when the SP500 is BELOW the 8 period simple moving average (8SMA) and sell the next bar (repeating until above 8SMA). The second chart is if you were to buy every close when the SP500 is ABOVE the 8SMA and exit the next bar (repeating until below 8SMA). Yes, being below this moving average is actually better for long returns.

Of course this is not true for all markets and moving averages, as mentioned. I pointed this out in another post on SeeItMarket where I dissected popular stocks and different moving average lengths here: https://www.seeitmarket.com/testing-moving-averages-popular-stocks-etfs-16809/

The point is that these trading truths like “above a moving average is bullish” and “below a moving average is bearish” need to be quantified and tested. It is important to stop thinking trading truths can be generalized to every market, timeframe, indicator value, etc. and just verify them yourself and you’ll be much better off!

Trading Truth #3 – Overnight Exposure is Risky

Sure earnings announcements and large unexpected news announcements typically happen after market close. Does this mean we should avoid trading overnight, if possible? So many want to day trade and be flat on the close that they miss a lot of gains from the overnight session (sometimes all of them).

Below you will see 30 top stocks where I breakdown their returns in the day session compared to the overnight session. The blue line signifies if you bought the open and sold the close the same day (day session) and the orange line signifies buying the close and selling on the next day’s open (simulating overnight exposure). As expected, there are no generalities in trading truths. Some stocks exhibit that most, if not all, returns come from the overnight.

Don’t get me wrong there are certainly edges to be had from avoiding overnight exposure and there can also be value added by increasing overnight exposure. Again, I am just making the point to dig deep into the data and understand where the edge(s) actually live.

Quick note: You can easily test overnight holds in Build Alpha by setting max hold to 1 bar and setting entry to this bar close and exit to next bar open in the settings menu.

In conclusion

Not all trading truths are “truths”. There are many that still have value! The edge is not in these truths but in determining the difference between a truth and a “truth”. Most do not take the effort to investigate these trading axioms found in trading books, blog sites, chat rooms, etc. If I have one goal then it is to make traders realize the value in testing everything – it is something I wish I would have started earlier. It is a super power to quickly test these ideas and trade/act accordingly!

I think many traders shy away from digging into the data because it requires effort and they think it will be a hard and arduous journey before they find some gold. But now I think it is increasingly easier than many may think.

That’s why Build Alpha’s main goal was (and still is) to make this type of testing easier for those with no programming skills or those tired of crunching endlessly in excel. The game is changing and things like this can be easily tested now. Now trading just comes down to those who will put in the work and who won’t: this should greatly increase your odds for success if you’re part of the former group.

Thanks for reading,

David

Using Python in Build Alpha [Creating Custom Signals]

Build Alpha and Python

As 2017 comes to an end, I want to introduce one more upgrade to BuildAlpha in its first year. As you know Build Alpha allows users to create, stress test, and even generate tradable code without ANY programming at all.

It also allows traders to use a custom drag and drop signal builder to create unique rules and signals to test alongside the pre-built Build Alpha signal library of nearly 5,000 signals – and growing (below is a picture of the drag and drop custom signal builder).

However, I have now added a python environment to give traders even more freedom. Traders now have the ability to code their own signals in python and test these signals in the Build Alpha strategy creation engine.

Again, you do NOT need ANY programming skills to use Build Alpha but if you WANT to you can now use python to create signals, but you do NOT have to as Build Alpha will work without. This is just an upgrade for the more sophisticated traders out there.

Python Example in Build Alpha

Below is a simple, 5-step walkthrough of how to create a signal using python and test it with other pre-built signals in Build Alpha. From the file menu, create a new custom signal which will open the window below. Set the type to ‘Python’.

Build Alpha then produces a simple to use template and we just need to set the variable file_name_base to the file we wish to do analysis on. Build Alpha will change this to whatever symbol(s) you have selected from the main interface at runtime. I have used the built-in Build Alpha data in the example below.

*Note* You can find the file path by right-clicking on your data file, selecting properties, and copy/pasting the path inside two quotes.

The only requirement is that we return a Signal list with the same length as data rows in our input file. This ensures there is a signal for every bar. Then simply save and access your custom signal from the main interface.

This new feature opens the door for what is possible in Build Alpha. Traders can leverage the power of python as well as BuildAlpha in extremely easy to use ways.

Moving Average Trading Strategy Python

Build Alpha’s python environment is a full python environment which means we can import external libraries. Let’s import the famous technical analysis library, talib, to create a moving average trading strategy with python.

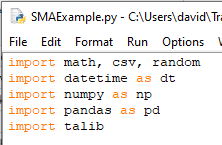
Create a new indicator and add `import talib` at the top of the python file.

Python Import talib for SMA strategy

Install Python Library for Technical Analysis Indicators

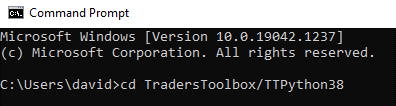
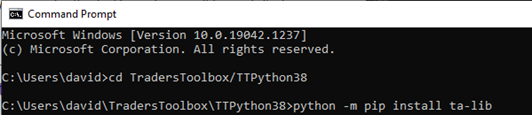
If you do not have talib installed, then open a command terminal and navigate to your python directory. You can type ‘cmd’ into the start menu of most Windows devices. If you used the Build Alpha installer then talib is included. However, you can navigate to your python directory like this: 

Command Prompt for Python Install

Then install talib using the following prompt. Notice the hyphen in ta-lib.

Command Prompt for Python talib install

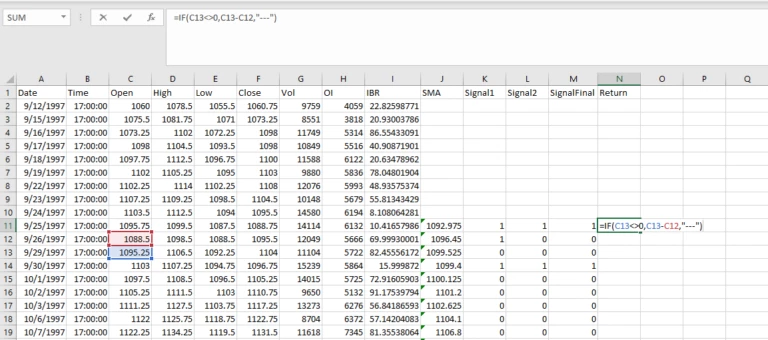
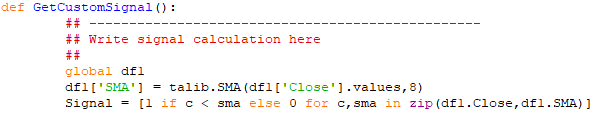
Next let’s calculate an 8-period moving average and create a signal that is true when the close price is below the 8-period SMA. Both code and screenshot are below.

def GetCustomSignal():

##-----------------------------------------

## Write signal calculation here

##

        global df1

        df1['SMA'] = talib.SMA(df1['Close'].values,8)

        Signal = [1 if c < sma else 0 for c,sma in zip(df1['Close'],df1['SMA'])]

`Moving Average Calculation Python Code talib

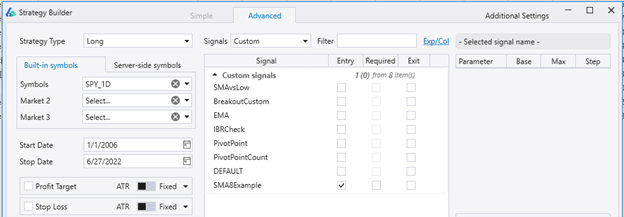
Then you can access this signal in the Custom list of the main Strategy Builder screen.

Custom Signals Build Alpha Interface

You can then combine it with any other Build Alpha signal or feature as if it were a built-in signal. This one of course is a built-in signal but made for a simple talib example.

Algorithmic Trading Python

Python is the fastest growing and most versatile programming language making it extremely attractive for quantitative traders and developers. Many algo traders prefer python due to its easy-to-read code and simple syntax. Python does not require code block brackets or semi-colons to end statements, but still is object oriented providing a great mix of ease and flexibility.

Python for algorithmic trading is growing every day with new libraries and popular libraries being updated. TALIB is the most popular library, but many more advanced libraries continue to pop up. Algo trading with python has never been easier.

However, connecting to exchanges, handling live price data, and coming up with trading ideas can be a daunting task. The best part about coding is coming up with new signals. Build Alpha takes care of the heavy lifting enabling python traders to simply do the fun part: signal creation.

Summary

Build Alpha now supports the ability to import custom signals via python. This is additional functionality for programmers that want to leverage the speed and ease of Build Alpha. Reminder that this is extra and NO programming is needed to use Build Alpha’s built-in signals or drag and drop custom signal builder.

It has been one heck of a year for Build Alpha’s development and there is still so much to do in 2018! Thanks for all those that support the software; I am looking forward to next year.

Author

David Bergstrom Author Photo Trading Edge

David Bergstrom – the guy behind Build Alpha. I have spent a decade-plus in the professional trading world working as a market maker and quantitative strategy developer at a high frequency trading firm with a Chicago Mercantile Exchange (CME) seat, consulting for Hedge Funds, Commodity Trading Advisors (CTAs), Family Offices and Registered Investment Advisors (RIAs). I am a self-taught programmer utilizing C++, C# and python with a statistics background specializing in data science, machine learning and trading strategy development. I have been featured on Chatwithtraders.com, Bettersystemtrader.com, Desiretotrade.com, Quantocracy, Traderlife.com, Seeitmarket.com, Benzinga, TradeStation, NinjaTrader and more. Most of my experience has led me to a series of repeatable processes to find, create, test and implement algorithmic trading ideas in a robust manner. Build Alpha is the culmination of this process from start to finish. Please reach out to me directly at any time.

Mean Variance Optimization [Portfolio Construction]

What is Mean Variance Optimization?

Here is the definition from Investopedia.com“Mean–Variance analysis is the process of weighting risk (variance) against expected return. By looking at the expected return and variance of an asset, investors attempt to make more efficient investment choices – seeking the lowest variance for a given expected return or seeking the highest return for a given variance level.”

It also assumes investors are rational and would choose the asset that had lower variance if the expected return of two assets were equal. I will assume you all are!

In layman terms, there are many techniques of portfolio construction, but this test shows two things. 

  1. Does adding a strategy increase the overall risk:reward of your portfolio or not?
  2. What are the appropriate weights each strategy in my portfolio should be assigned?

This is certainly a crude explanation of mean-variance optimization, but this isn’t an academic blog.

Testing Mean Variance Optimization

This test can be done with either historical or “predicted” returns. We will assign random weights to each of the strategies in the portfolio; the sum of all the weights shall equal 1 (or 100% of allocated capital). After assigning weights to each of the strategies we can generate a risk-adjusted return value or Sharpe Ratio. This is the Sharpe Ratio had we traded each of these strategies with the weight we just assigned to each.

After thousands of tests assigning random weights, we generate a plot of the thousands of Sharpe Ratios. We are trying to find the best weightings to lower the variance in our portfolio while keeping the return as high as possible.  The leftmost dots create the Efficient Frontier and the leftmost dot is considered the minimum variance portfolio. The graph’s legend or color bar shows the highest Sharpe Ratio possible. This portfolio contains the three “checked” strategies on the far left of the photo below and the highest Sharpe from this portfolio is 2.17.

We can then hover over the graph and view the weights that produced a specific Sharpe value or dot on the chart.  The idea here is we can see how to weight the strategies in our portfolio to give us the “optimal” or best risk-adjusted reward (optimal portfolio construction) – which is our ultimate goal as trading system developers.

The red dot shows equal weights or how our portfolio would have performed had we traded each strategy with the same position size.

Does this strategy improve my portfolio?

Now to answer the question “does adding this strategy to my portfolio help or hurt expected performance”?  In Build Alpha’s portfolio mode, you can simply include or remove strategies and quickly see if the Sharpe Ratio increases or decreases with this Mean Variance analysis. Below I have selected one additional strategy (see four checks on the far left of the photo below) and you can see a Sharpe Ratio improvement from our original 2.17 to 2.50.

Adding new individual strategies will almost certainly “smooth” out the portfolio’s equity curve, but does it actually increase risk: reward? This test gives a simple, quick way to quantify the addition (or subtraction) of a strategy.

Next Test

Here I have changed the ES (S&P500 strategy) in the portfolio. I unselected the top ES strategy and selected the other ES strategy. You can see the Sharpe Ratio worsening as it appears this portfolio only achieved 2.28 (vs. previous portfolio configuration of 2.50). This is a good strategy but just does not work as well with the other strategies in the portfolio as the original ES strategy we had included.

Mean Variance Optimization Summary

We want our money to be as efficient as possible and this test or techniques of portfolio construction gives us another check if it is or not.  No point in trading a strategy that is not expected to increase our overall risk reward.

It is now much simpler to compare strategies or to decide whether or not to include a strategy into a portfolio or not. Much of trading comes down to making informed decisions that maximize risk:reward and running this type of analysis certainly increases the information at your disposal. It is now only one click away in portfolio mode.

-Dave

PS: Build Alpha allows traders to import systems built outside Build Alpha for analysis and portfolio construction. Now you can do all of this analysis on Build Alpha strategies, your own strategies, or any combination between.

Author

David Bergstrom Author Photo Trading Edge

David Bergstrom – the guy behind Build Alpha. I have spent a decade-plus in the professional trading world working as a market maker and quantitative strategy developer at a high frequency trading firm with a Chicago Mercantile Exchange (CME) seat, consulting for Hedge Funds, Commodity Trading Advisors (CTAs), Family Offices and Registered Investment Advisors (RIAs). I am a self-taught programmer utilizing C++, C# and python with a statistics background specializing in data science, machine learning and trading strategy development. I have been featured on Chatwithtraders.com, Bettersystemtrader.com, Desiretotrade.com, Quantocracy, Traderlife.com, Seeitmarket.com, Benzinga, TradeStation, NinjaTrader and more. Most of my experience has led me to a series of repeatable processes to find, create, test and implement algorithmic trading ideas in a robust manner. Build Alpha is the culmination of this process from start to finish. Please reach out to me directly at any time.

Free Friday #20 – Time Windows

There has been a recent popularity regarding time windows and it is one I completely agree with! There are certain structural changes that happen throughout the 24-hour session and as a trader it is important to take note of these when designing a system or strategy (or just placing trades). For example, how is my strategy’s performance when Asia closes? How about when the US opens?

There are also some blatant market anomalies that still exist regarding time windows. The most obvious one, and often popularized by Eric Hunsader of Nanex (and others), is the S&P500 futures performance from 2am to 3am. This little one-hour window looks like quite the edge – and has been persistent despite being publicly known for quite some time.

Using Time Windows to Trade

There are plenty of ways to use the time of the day to your advantage. For instance, only find trades/patterns that exist during a window of time where you might be at your desk. Another simple approach is to filter out unfavorable periods of the day to improve your performance (obviously proper testing methods important here).

My main point is… if you start paying attention to time windows you may be surprised as to what simple edges you’ll discover. It has certainly been a staple in my research for quite a while and I know many other successful traders who put a lot of emphasis on this.

Build Alpha Upgrades

I’ve recently upgraded Build Alpha to allow for intraday strategy creation and time window filtering (among other things). Inside BA you can now select (and create your own) time windows to use as input in the strategy creation engine. There is also a time of day test which allows you to select certain windows to see if it improves strategy performance.

Here are a few examples

Free Friday 20 Example Strategy

Below is a simple strategy that shorts EURUSD (I used the futures contract) at 5:00 am EST every Wednesday, Thursday, and Friday morning. This idea simply holds the short trade for 3 hours.

These two might not be standalone strategies, but can certainly give you a head start for continued research, act as a filter for other strategies or be paired with other ideas to create fully operational strategies.

Trading is extremely competitive. Looking at price alone may be too naïve in today’s market; there is simply too much computing power looking at it. If you’re struggling to find quantified edges then maybe it is time (pun intended) to start pairing price action with time filters.

As always, thanks for reading. And please stay safe with all these hurricanes!

Dave

Thanks for reading,
Dave

Intraday Checks and Hidden Edges

What is an intraday check? It is a phrase I am trying to coin, but I will explain the concept here..

There are certain rules (mainly for intraday strategies) that I believe should be applied to each strategy to check if there are any “hidden edges” in the underlying strategy.

Intraday Trading Checks

So what are these rules? And how can we test them? Well, Build Alpha now offers a test that allows users to test any intraday trading strategy to find out if it is as efficient as it can be or if there are any “hidden edges” within the strategy as I like to call it. Here are the additional intraday rules or checks.

  1. Time windows. Is the strategy improved by only trading between certain times of the day?
  2. Max Trades per day. A maximum number of trades per day count. Is the strategy improved by limiting the number of trades per day?
  3. Minimum P&L per day. Is the strategy improved by limiting the amount of money it is allowed to lose per day? For example, automatically turn the strategy off for the day once you’ve lost $500 today.
  4. Maximum P&L per day. Is the strategy improved by stopping the trading when an amount of money is earned per day? For example, automatically stop trading for the day once you’ve made $2,500 today.

Obviously, these tests are common and obvious ideas to look for hidden edges and strategy improvements – and of course, with all things, we need to use proper data analysis techniques (in vs out of sample, sample size, etc.) which I am not going to get into in this post as I have other posts regarding that.

Test Setup in Build Alpha

The Intraday Checks test can be easily configured by clicking on the “Test Settings” button and configuring the right-hand side of the pop-up window seen below:

The coolest feature of this addition to the software is the ability to add any of the newly found rules to the generated code for any of the supported Build Alpha platforms. For example, if you find a rule (or few rules) that improves the original strategy then you can double-click the test result and BuildAlpha will automatically incorporate those rules when generating trading code for TradeStation, MultiCharts, Ninjatrader or MetaTrader.

Build Alpha Intraday Checks Example

Here is a photo after selecting (double-clicking) on a test result which would then add this test’s rules to the exportable code. The highlighted red (selected) strategy’s rules can be seen at the bottom of the graph.

Trading System

This selected strategy would add the rules

  • Max Trades per day: 2
  • Only take entries between 2:00 am and 12:00pm
  • Stop trading each day after losses reach $1,000 per day

Finally, the histograms below the graph show the distribution of all the tests on the intraday rules. This is important to make sure you’re not just selecting an outlier but that the underlying distribution/simulation itself was strong. Again, this post is not meant to get into selection bias and other potential pitfalls as I have other content about that.

All in all, it is important to search every nook and cranny to make sure we’re not leaving money on the table or missing an easy edge or strategy filter. This test aims to help in that regard.

For those interested in more Intraday Trading tools take a look at the Intraday Edge test.

Thanks for reading

Dave