Free Friday #12 – Noise Test
Happy Friday. This week’s Free Friday strategy is for $XLP or the ETF that tracks US Consumer Staples. However, it was designed taking input from two other popular ETFs.
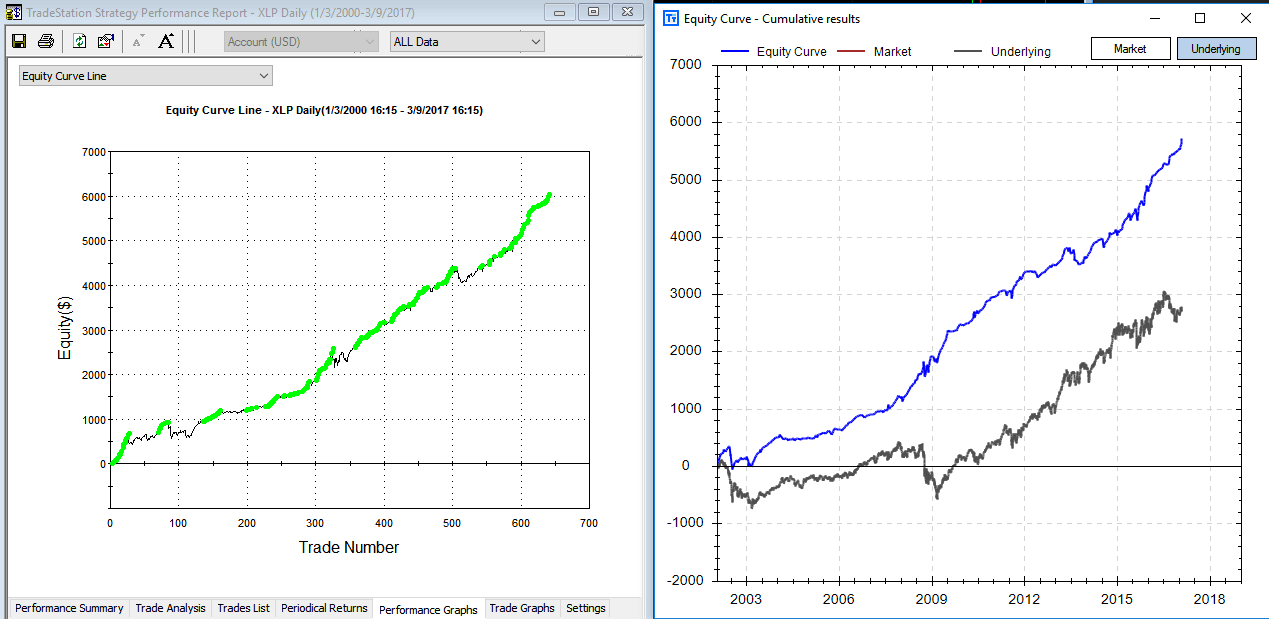
Here is the equity curve and backtest results. The left is a graph created by TradeStation and the right is a graph showing our backtest results (blue) and XLP buy and hold (grey). The chart on the right, created by Build Alpha, is plotted by date whereas the TradeStation chart is plotted by trade number – both software have the ability to plot both x-axis styles.
This strategy uses only 3 rules for entry
- XLP’s 2 Period RSI must be lower than it was 1 bar ago
- XLU – Utility ETF – must close below its midpoint
- XLE – Energy ETF – must be below its 3 period Simple Moving Average
The exits for this strategy are two-fold
- Maximum hold of 4 days
- Exit on the first profitable close
Below are the trade statistics for this Free Friday Strategy.

I know want to introduce another, and new, Build Alpha test to help validate trading strategies. I first mentioned this test here: Better System Trader Podcast. The Noise Test is a popular test that allows the user to randomly add AND subtract noise from the historical price data. The user can specify how much of the data he/she wants to adjust and by how much he/she wants to adjust the data.
For example, the user can change 50% of the data by 25% of the average true range. This means we would adjust the data by either adding or subtracting up to 25% of the average true range to any of the opens, highs, lows or closes until we’ve adjusted 50% of the data.
We now have a “new” data set that contains a different amount of noise. Build Alpha will continue to create 100 new data sets all with differing noise characteristics. Finally, we will re-trade our strategy on these 100 new data sets to see how well it performs had the noise been different.
The idea is… does your strategy fall off a cliff if some other amount of noise is introduced or subtracted to your underlying data set?
I will show results for two noise tests I ran on this Free Friday strategy.
My first configuration was to adjust all the opens, highs, lows and closes at the same rate (20%). Furthermore, I only wanted to add or subtract up to 20% of the average true range whenever making a change.


As you can see the strategy is not very “anti-fragile”. That is, changing the noise amount never produced better results than our backtest. This can be a major red flag. However, the strategy still maintained general profitability over the 100 tests. I was pleased enough to run a second test. This time more creative with the adjustments to the data.
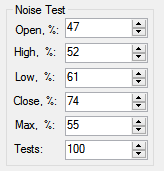
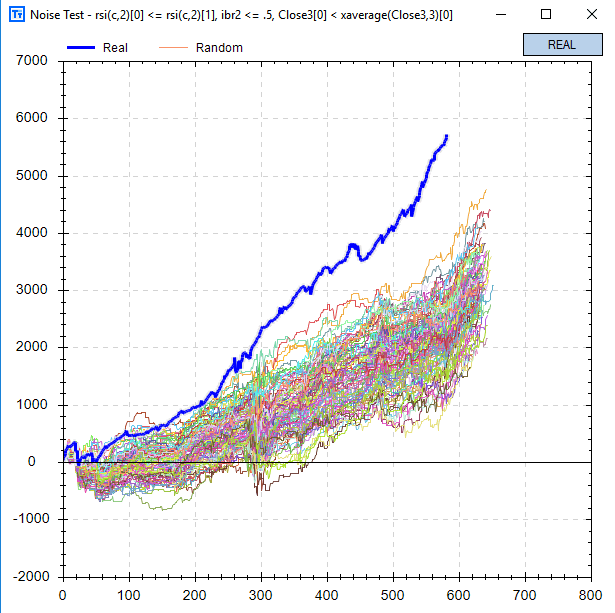
Adding or subtracting up to 55% of the average true range to differing amounts of the opens, highs, lows, and closes produced the above graph. This Noise Test has me much less confident in the strategy. For instance, our original backtest is now a significant outperformer. This generally means that it was too reliant to the underlying data. However, it does maintain overall profitability across the tests so may contain some actual edge nonetheless.
If up to me, I would continue researching this strategy and others as this is not an overwhelming pass.
The Noise Test is just another robustness check that Build Alpha offers to give traders and money managers every tool possible.
Happy Friday,
Dave
Old Posts:
- Free Friday February 2017 Update
- What is E-Ratio
- Free Friday 11 – Free Friday 11 – Sample Size
- Free Friday 10 – Sizing with Monte Carlo
- Free Friday 9 – Intermarket Signals
- Free Friday January 2017 Update
- Free Friday 8 – Randomized Monte Carlo
Thanks for reading,
Dave
Hey very cool blog!! Guy.. Beautiful.. Wonderful.. I will bookmark your website and take the feeds additionallyKI am satisfied to search out numerous useful information right here in the publish, we want develop more techniques on this regard, thank you for sharing deekgfbfbfak
Thanks for reading!